
Building Event Intelligence Dashboards
Building Event Intelligence Dashboards
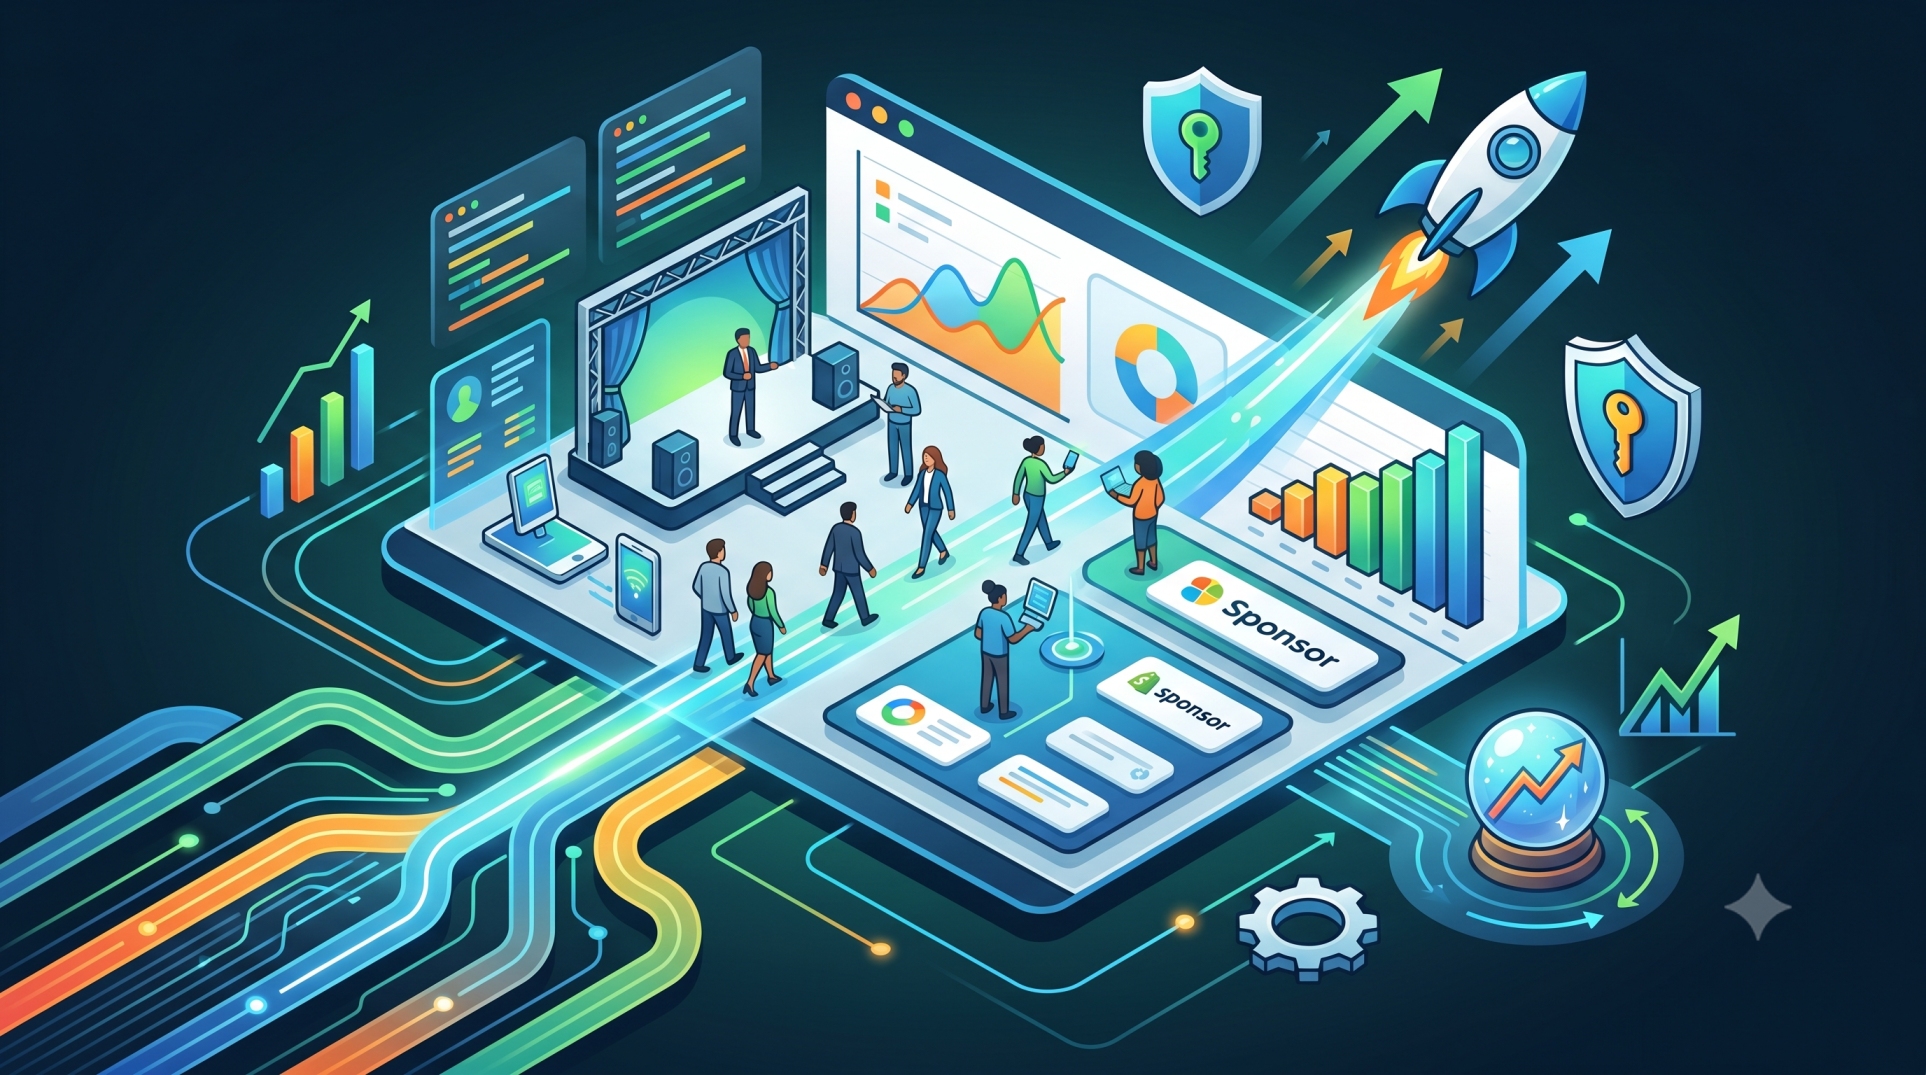
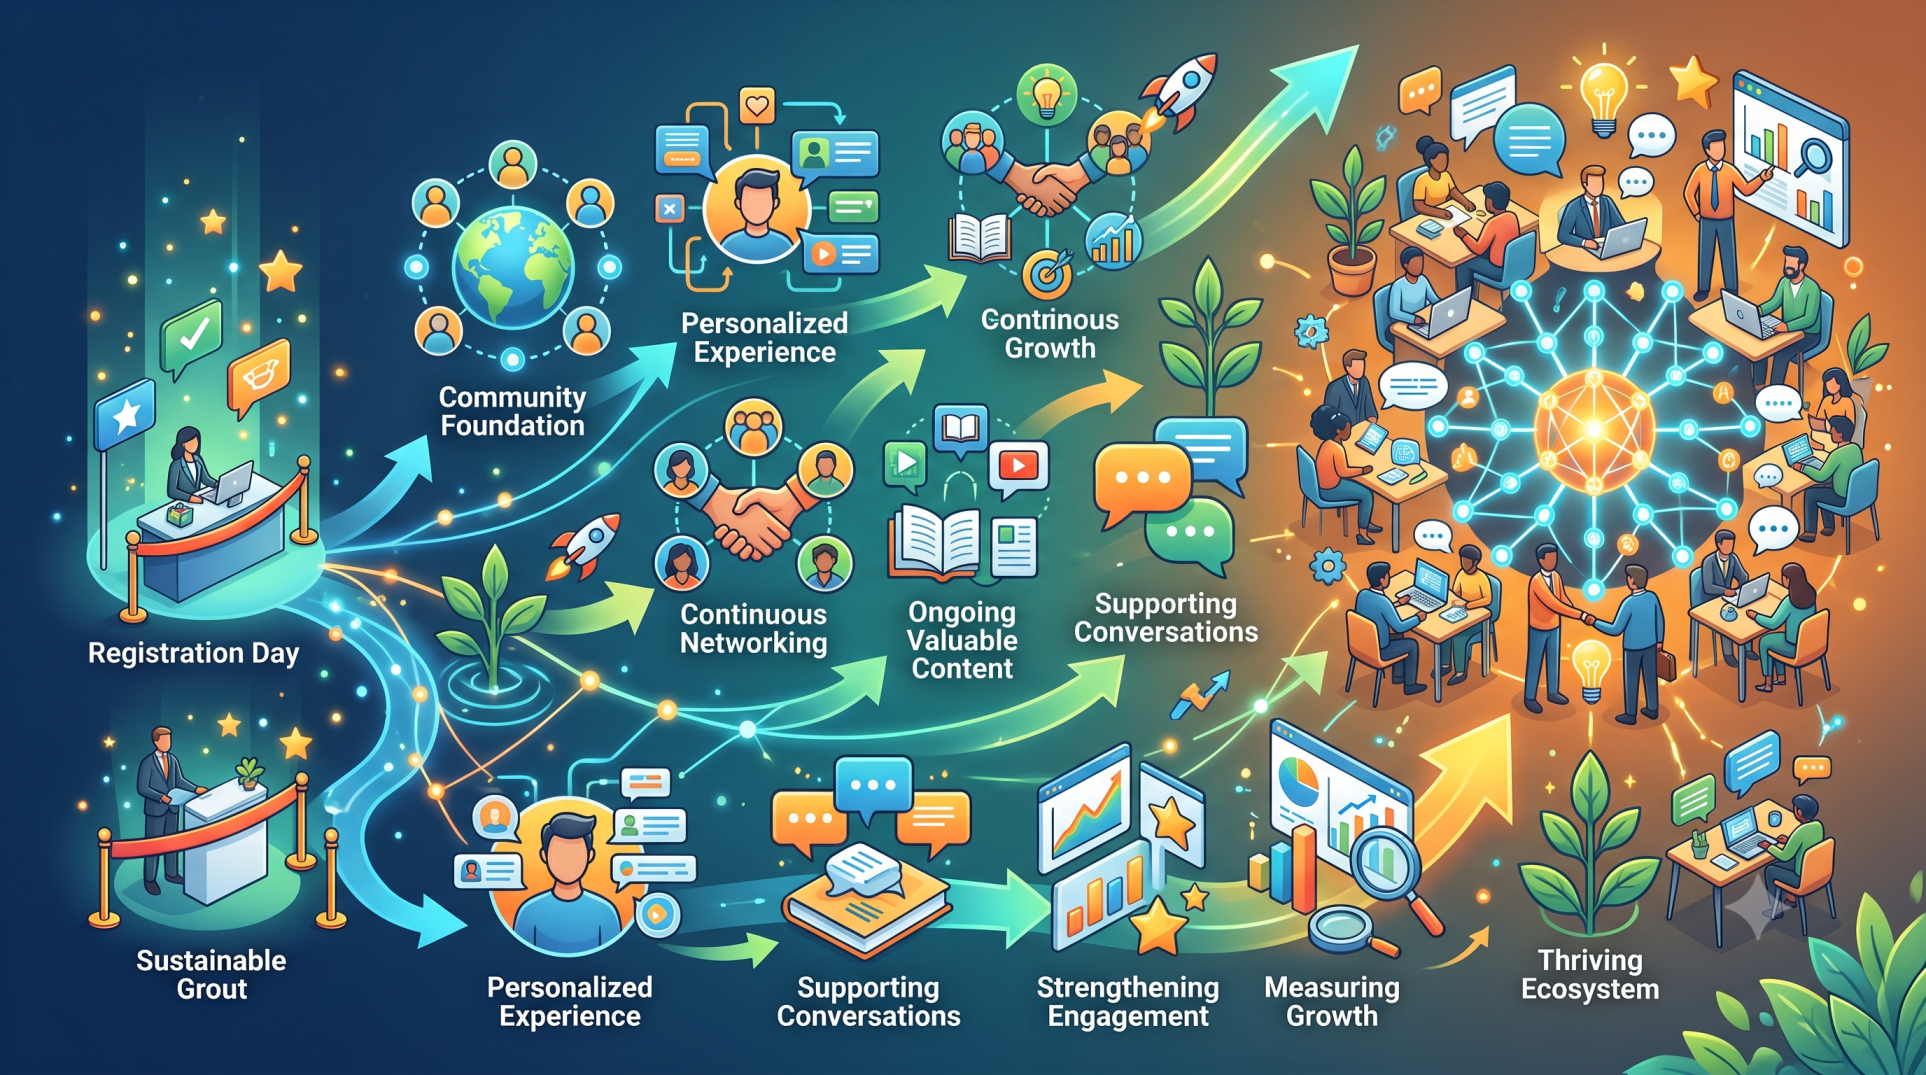
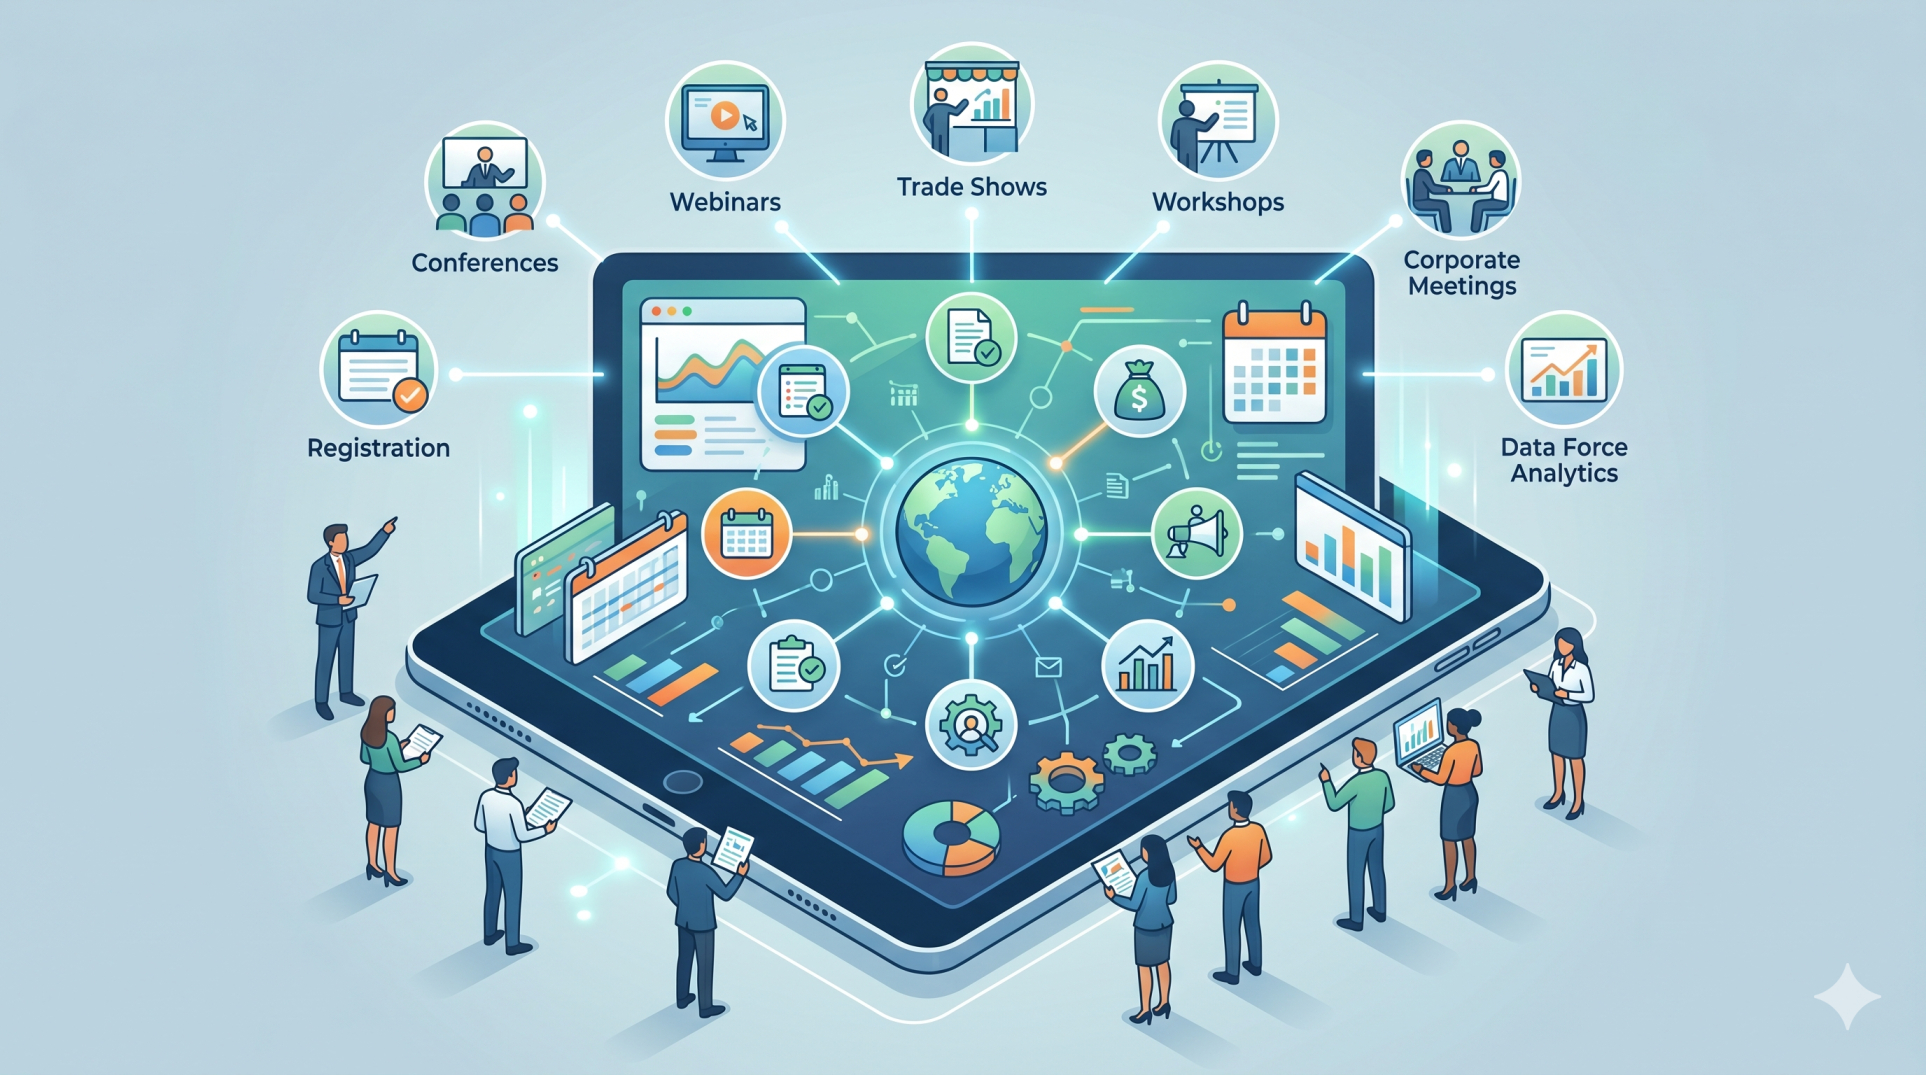
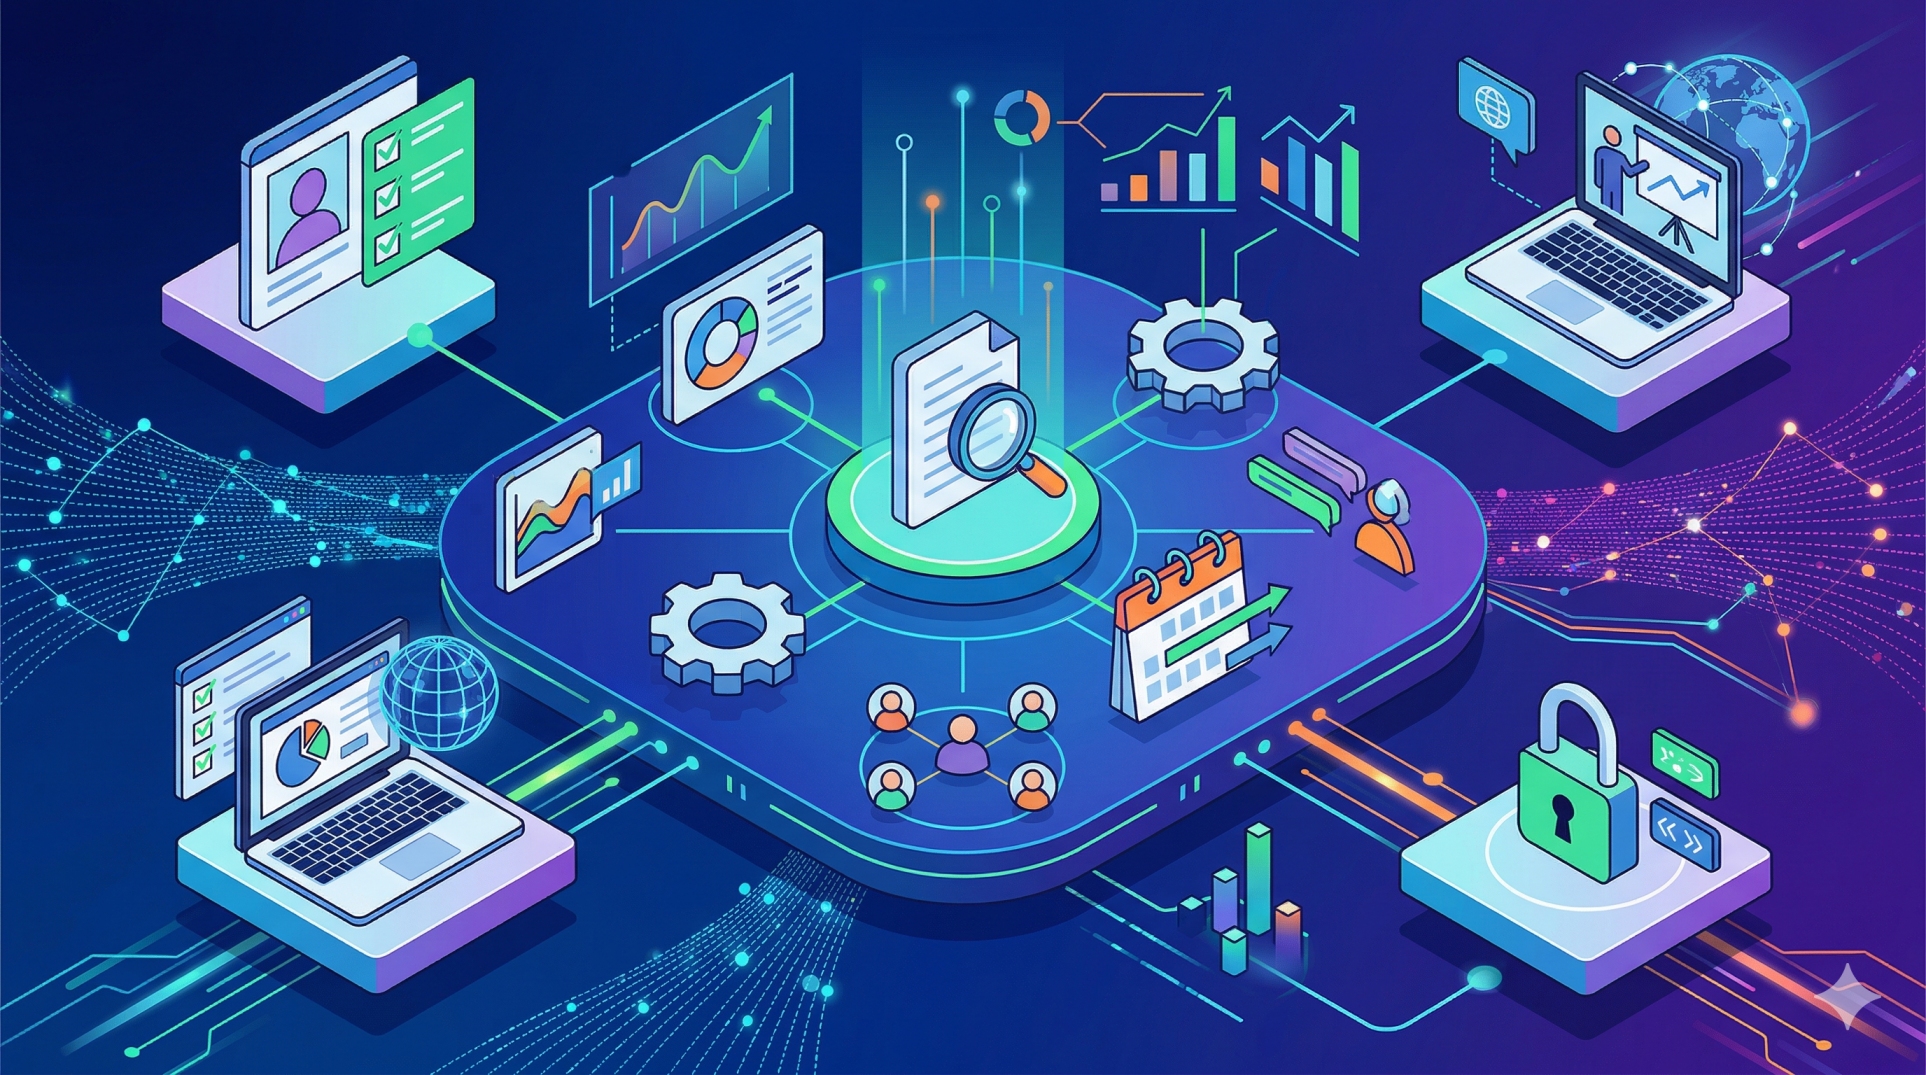
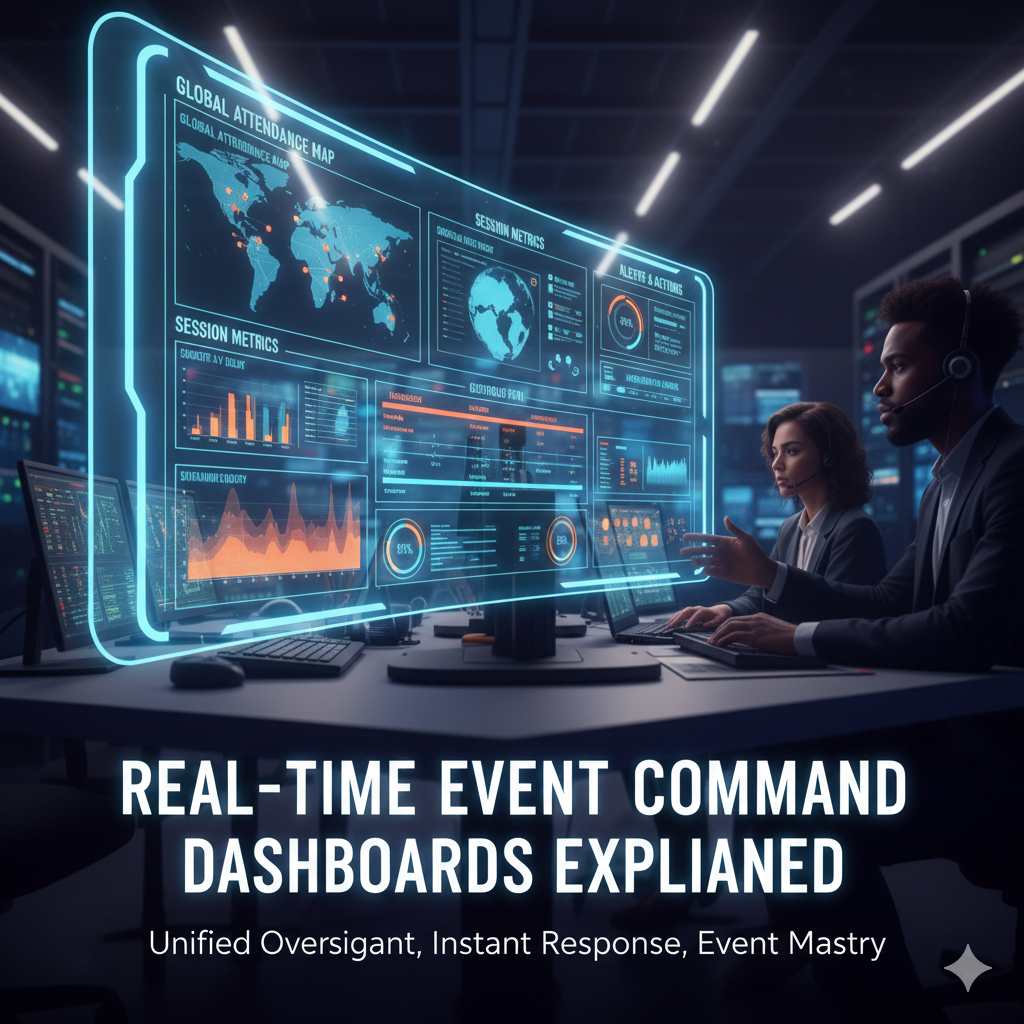
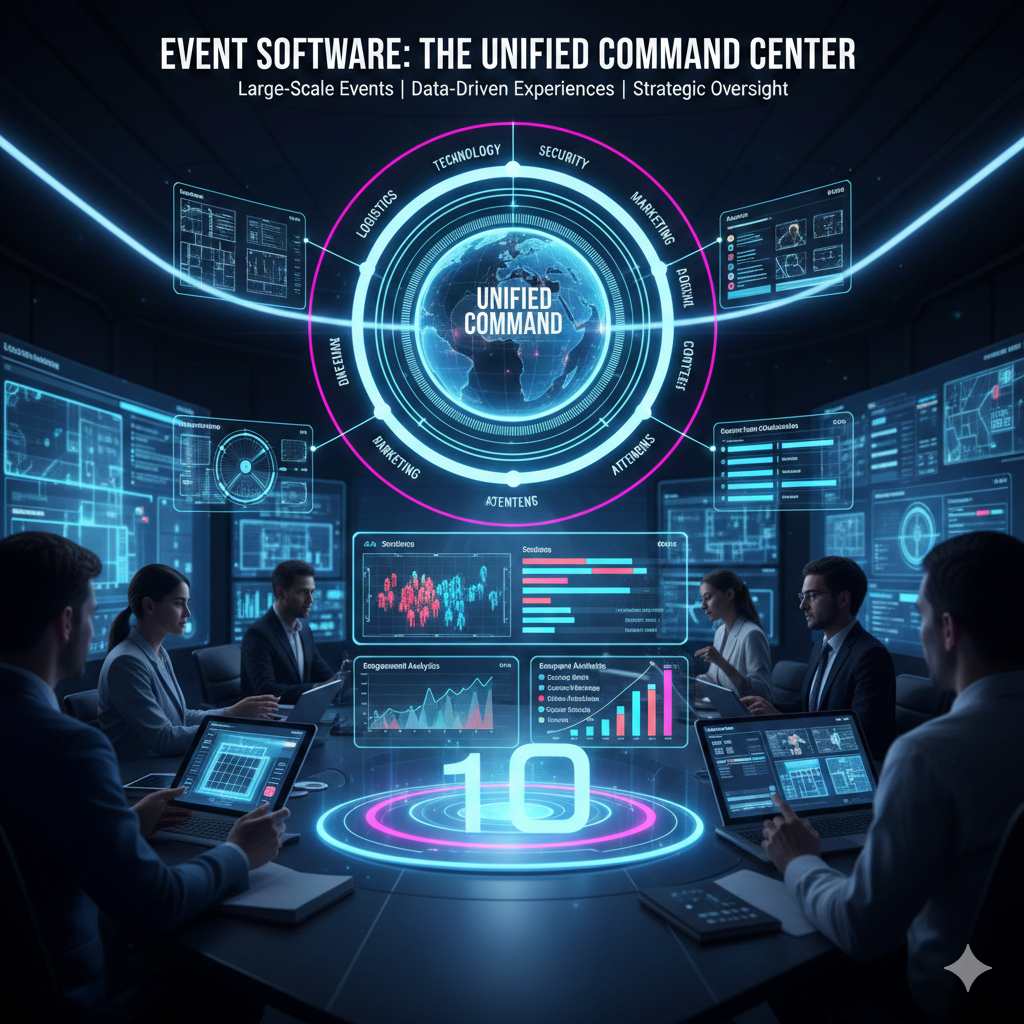
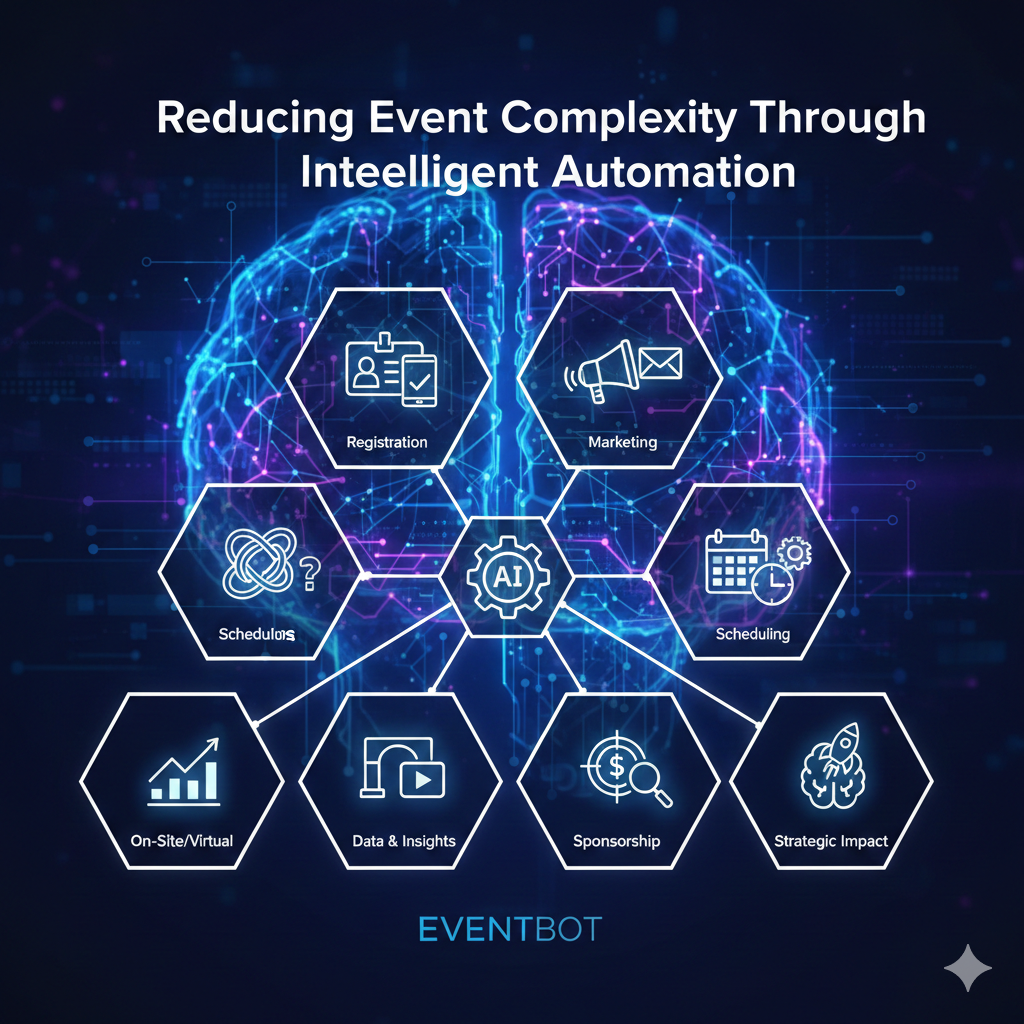
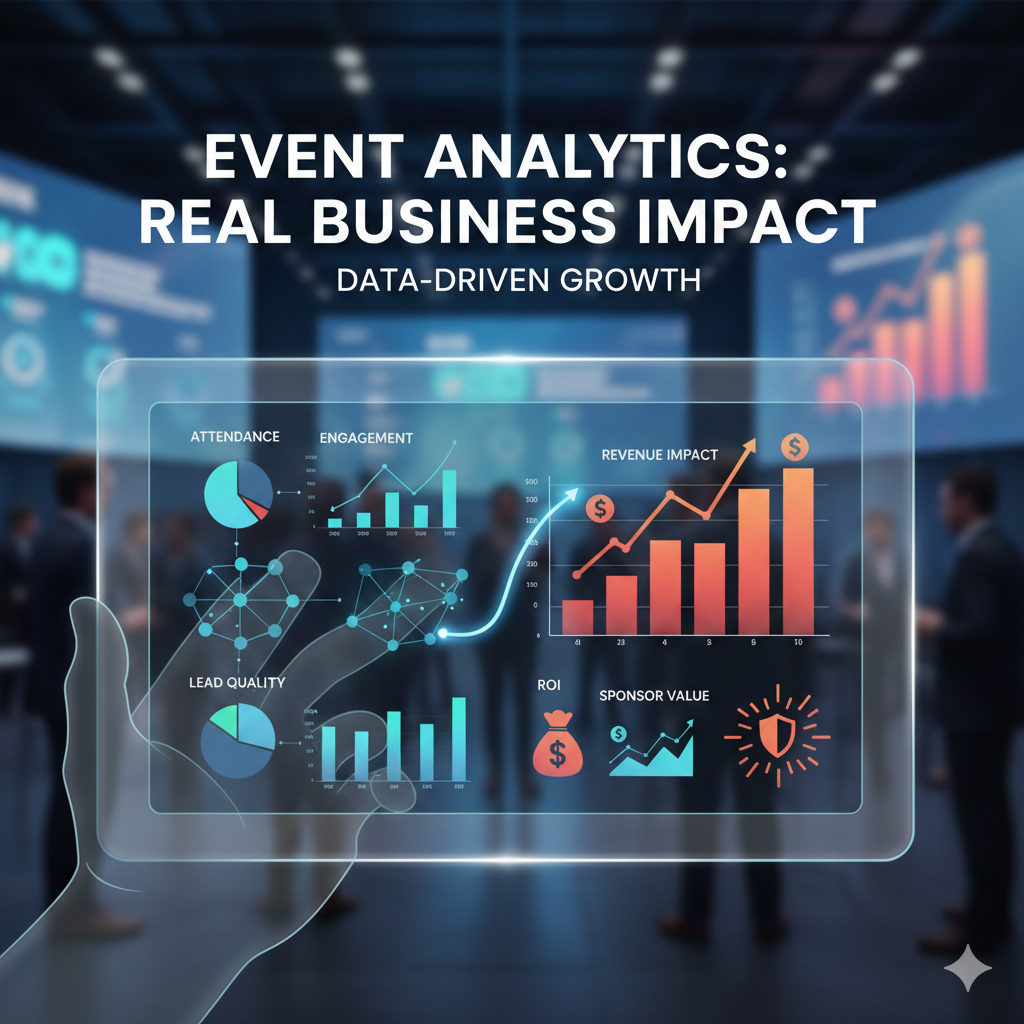
Event organizers today generate massive amounts of data before, during, and after events. Transforming this information into actionable insights requires more than standard reporting tools. Event Intelligence Dashboards provide a centralized view of key metrics, enabling organizers to monitor performance, optimize attendee experiences, and make data-driven decisions in real time. By combining analytics, visualization, and operational data, these dashboards help maximize event success and long-term value.
Step 1: Understanding Event Intelligence Dashboards 📊
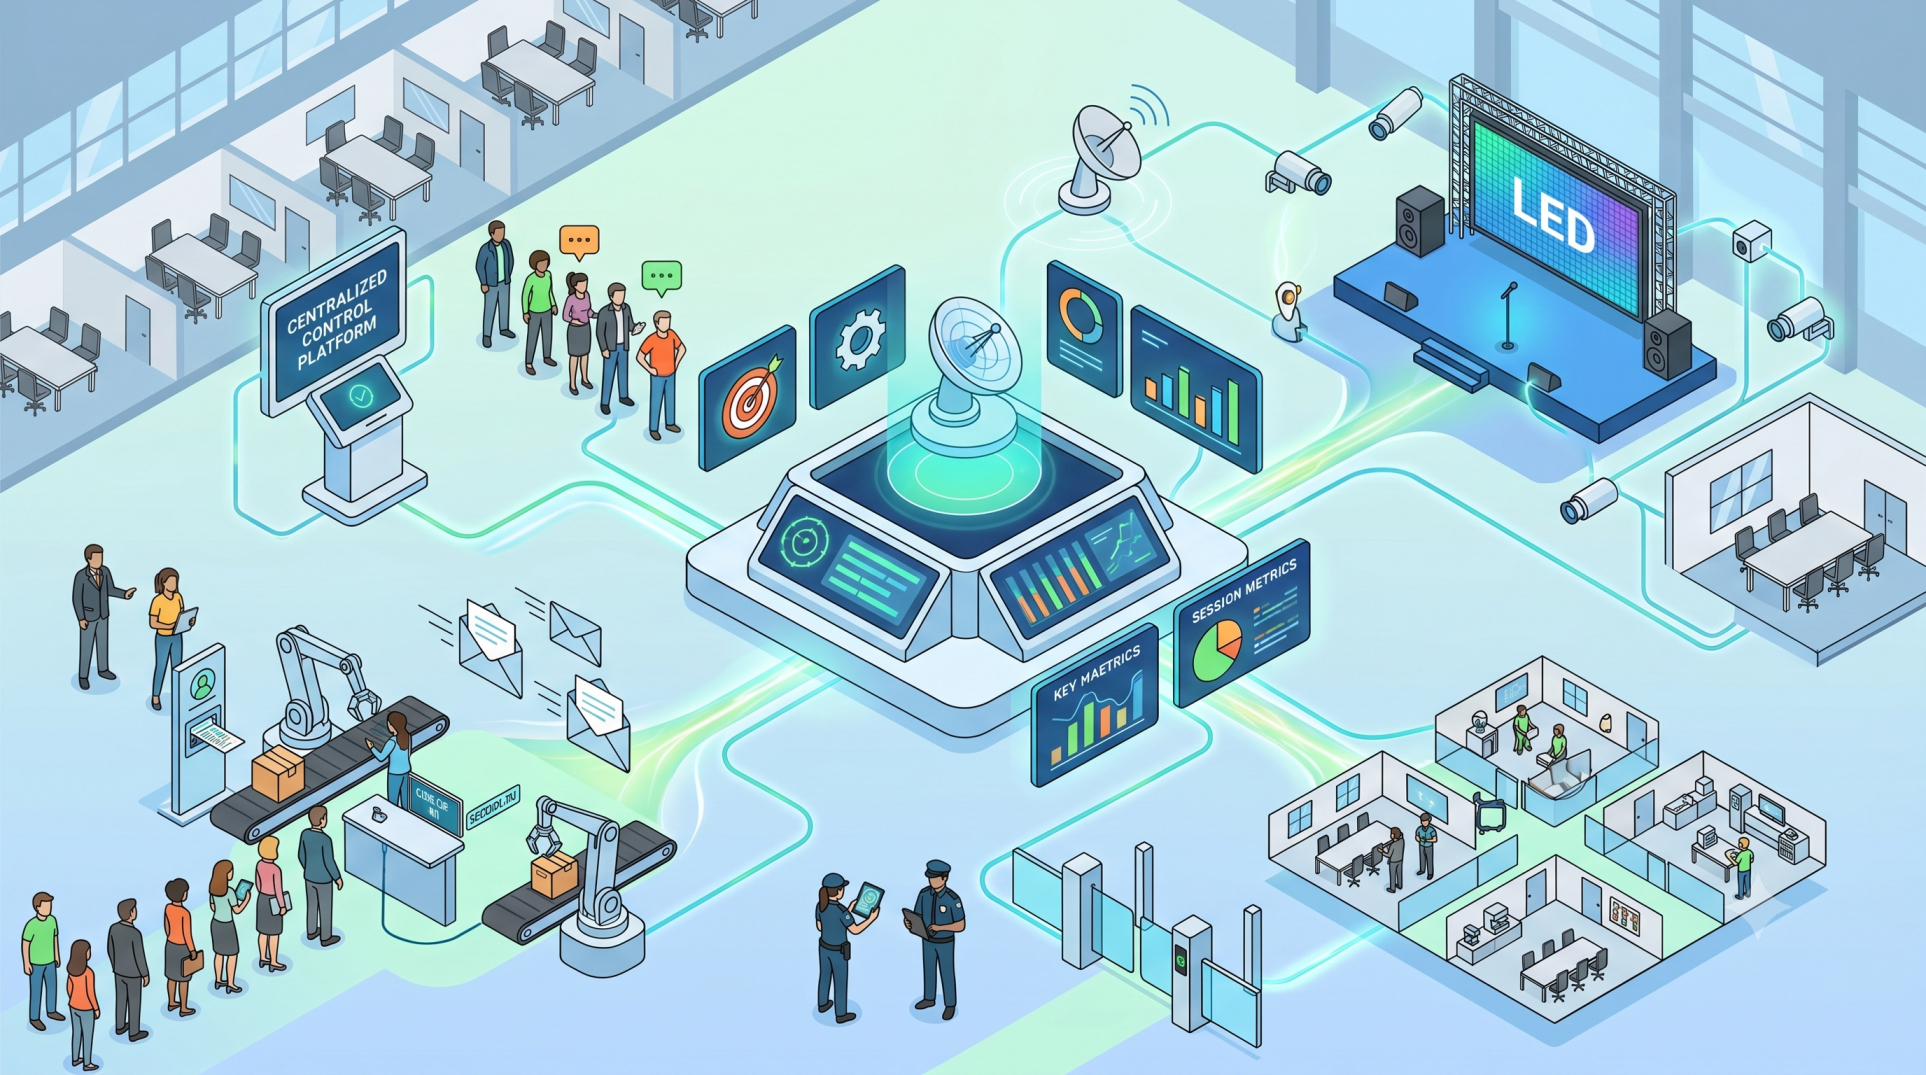
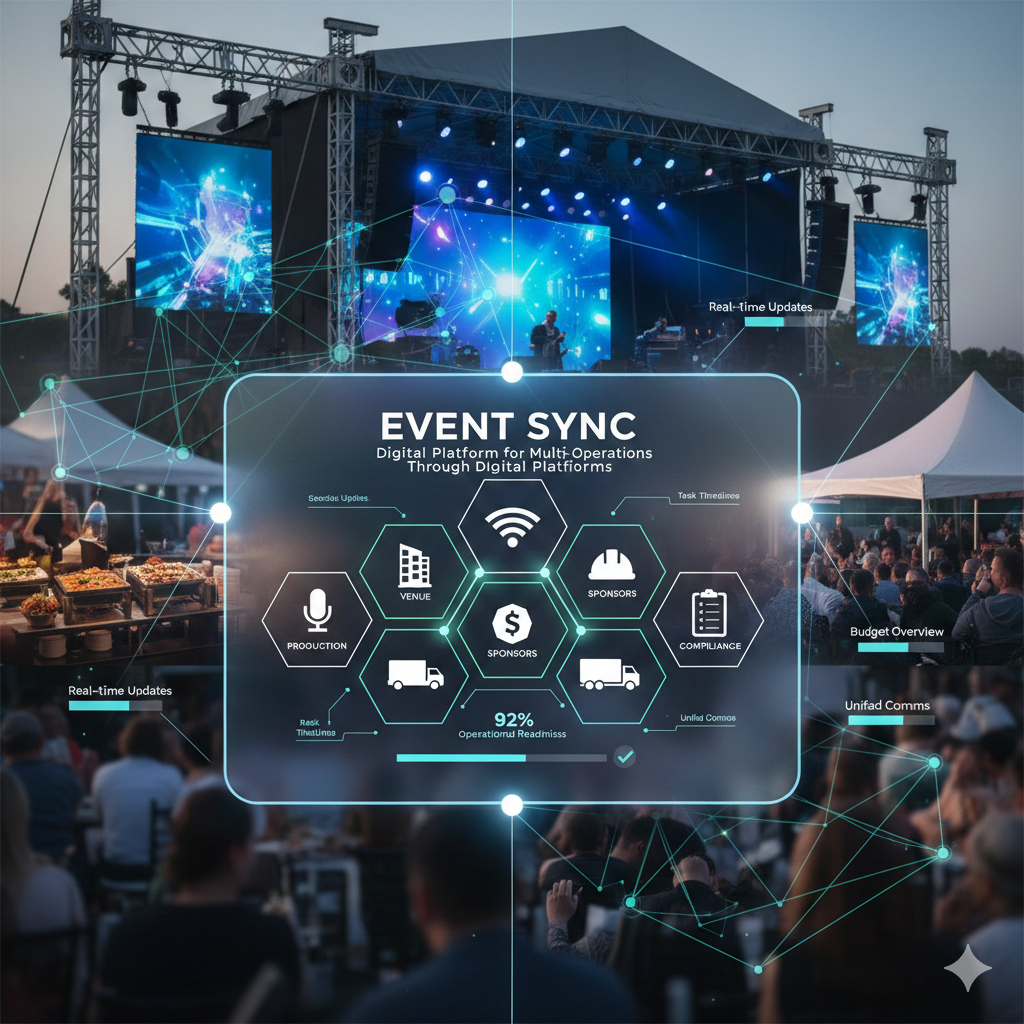
• Event Intelligence Dashboards consolidate data from multiple event systems into a unified view 🔗
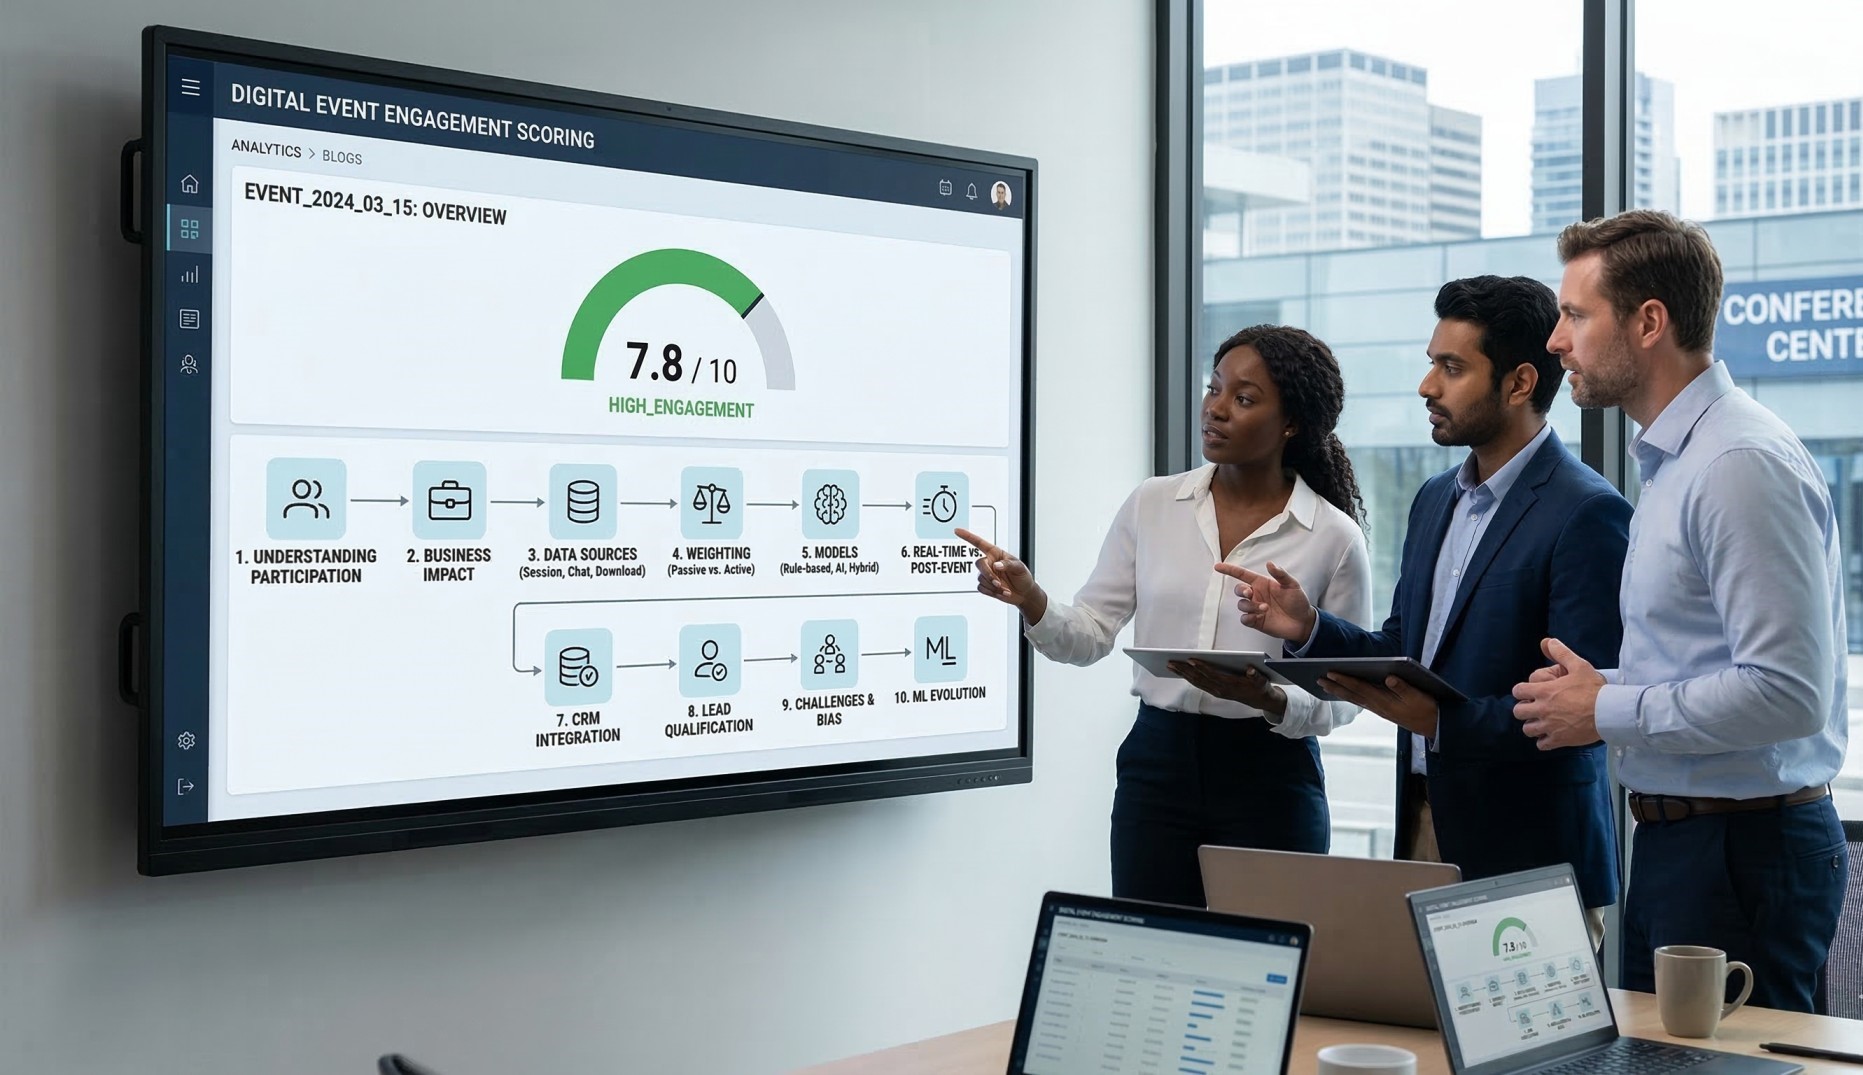
• They provide real-time visibility into event operations and attendee engagement 👀
• Support strategic and operational decision-making across teams 🎯
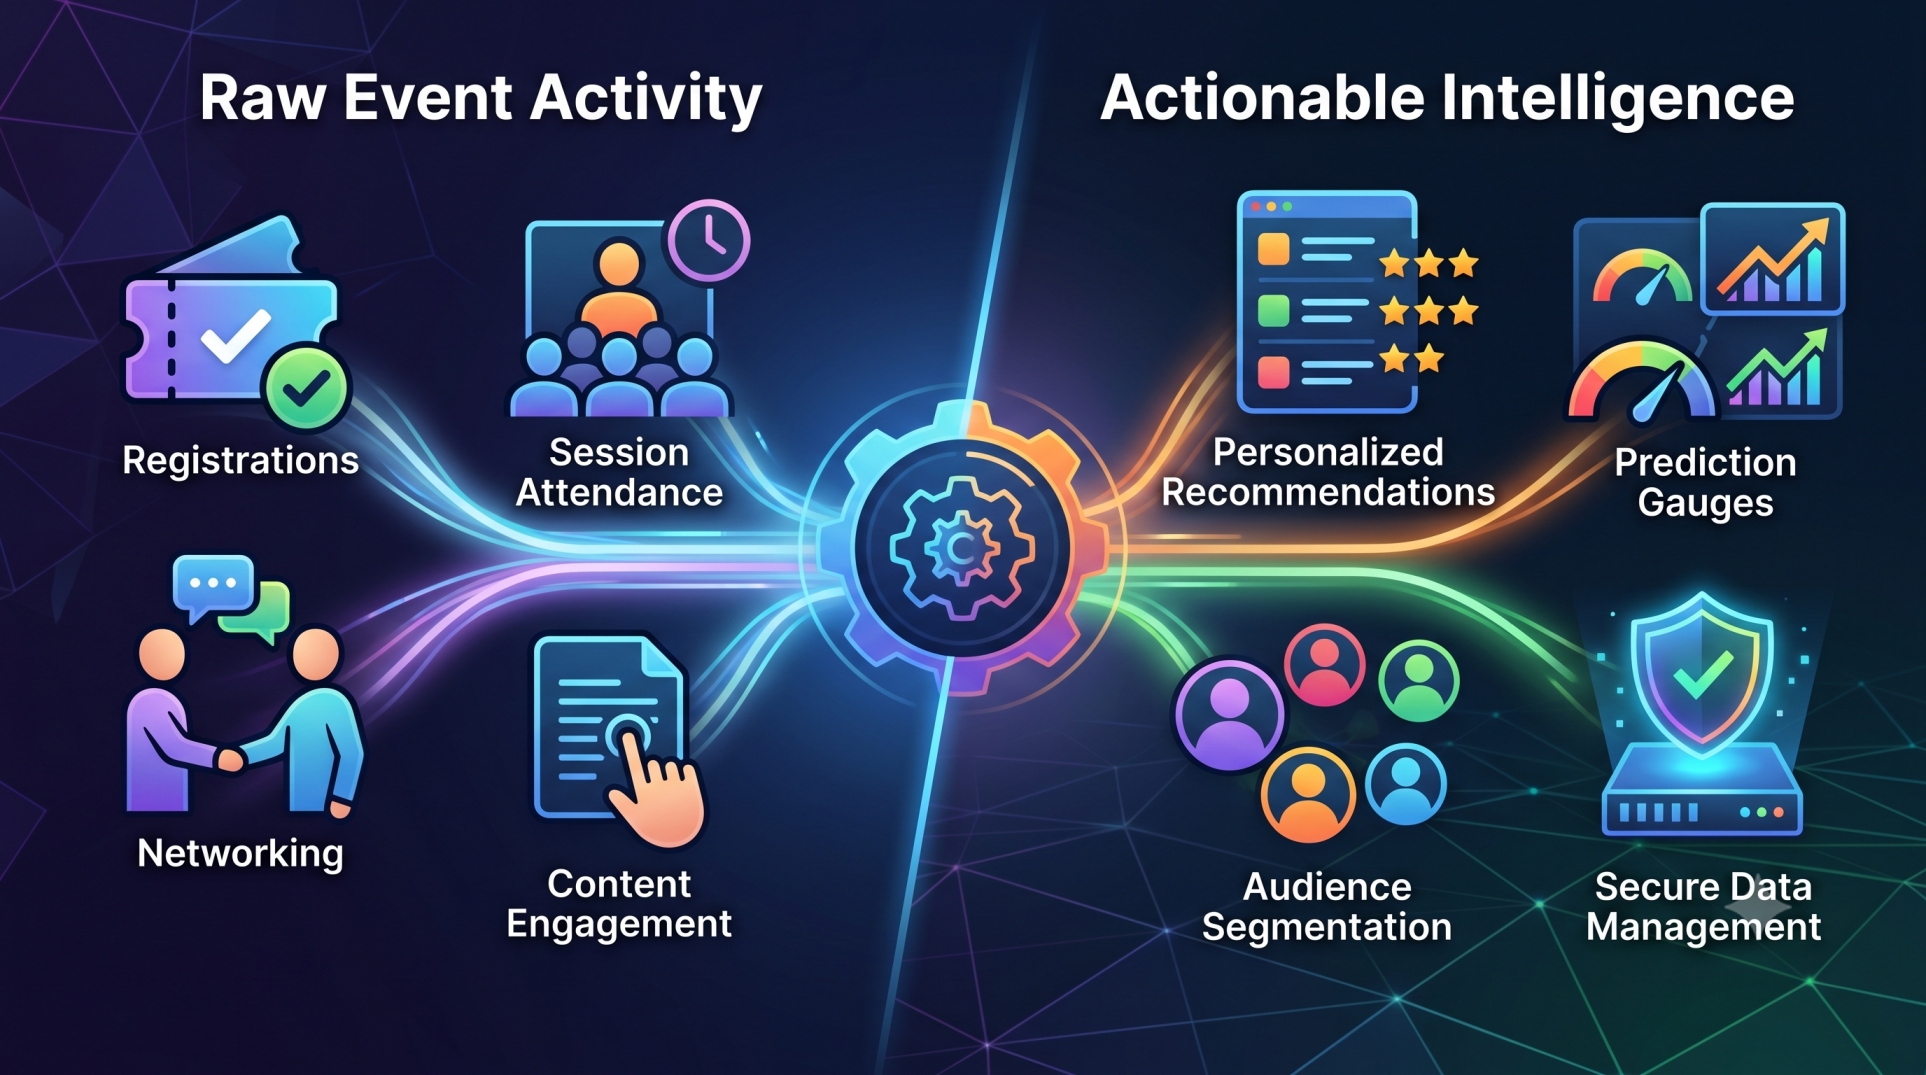
• Transform raw event data into actionable insights 💡
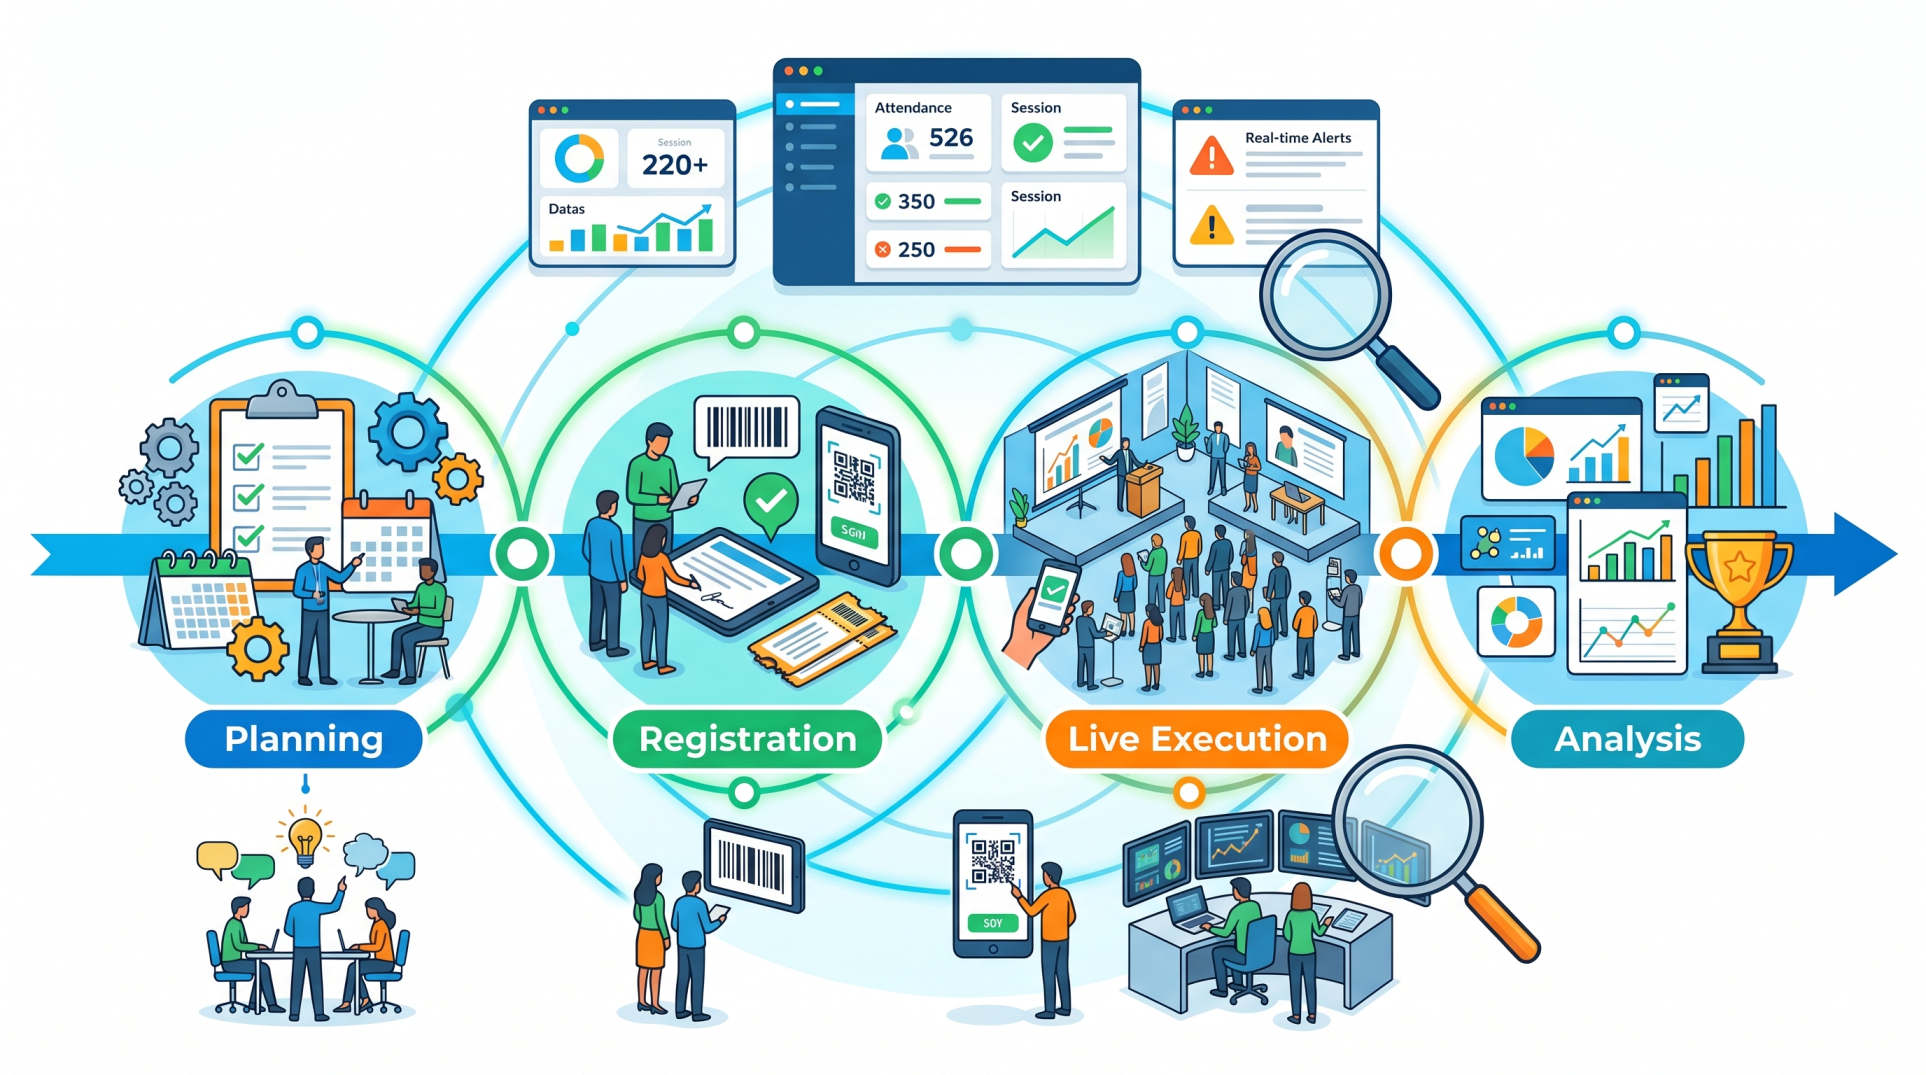
• Improve event planning, execution, and post-event analysis ✅
Step 2: Identifying Key Performance Indicators (KPIs) 📈
• Track registration and attendance metrics 👥
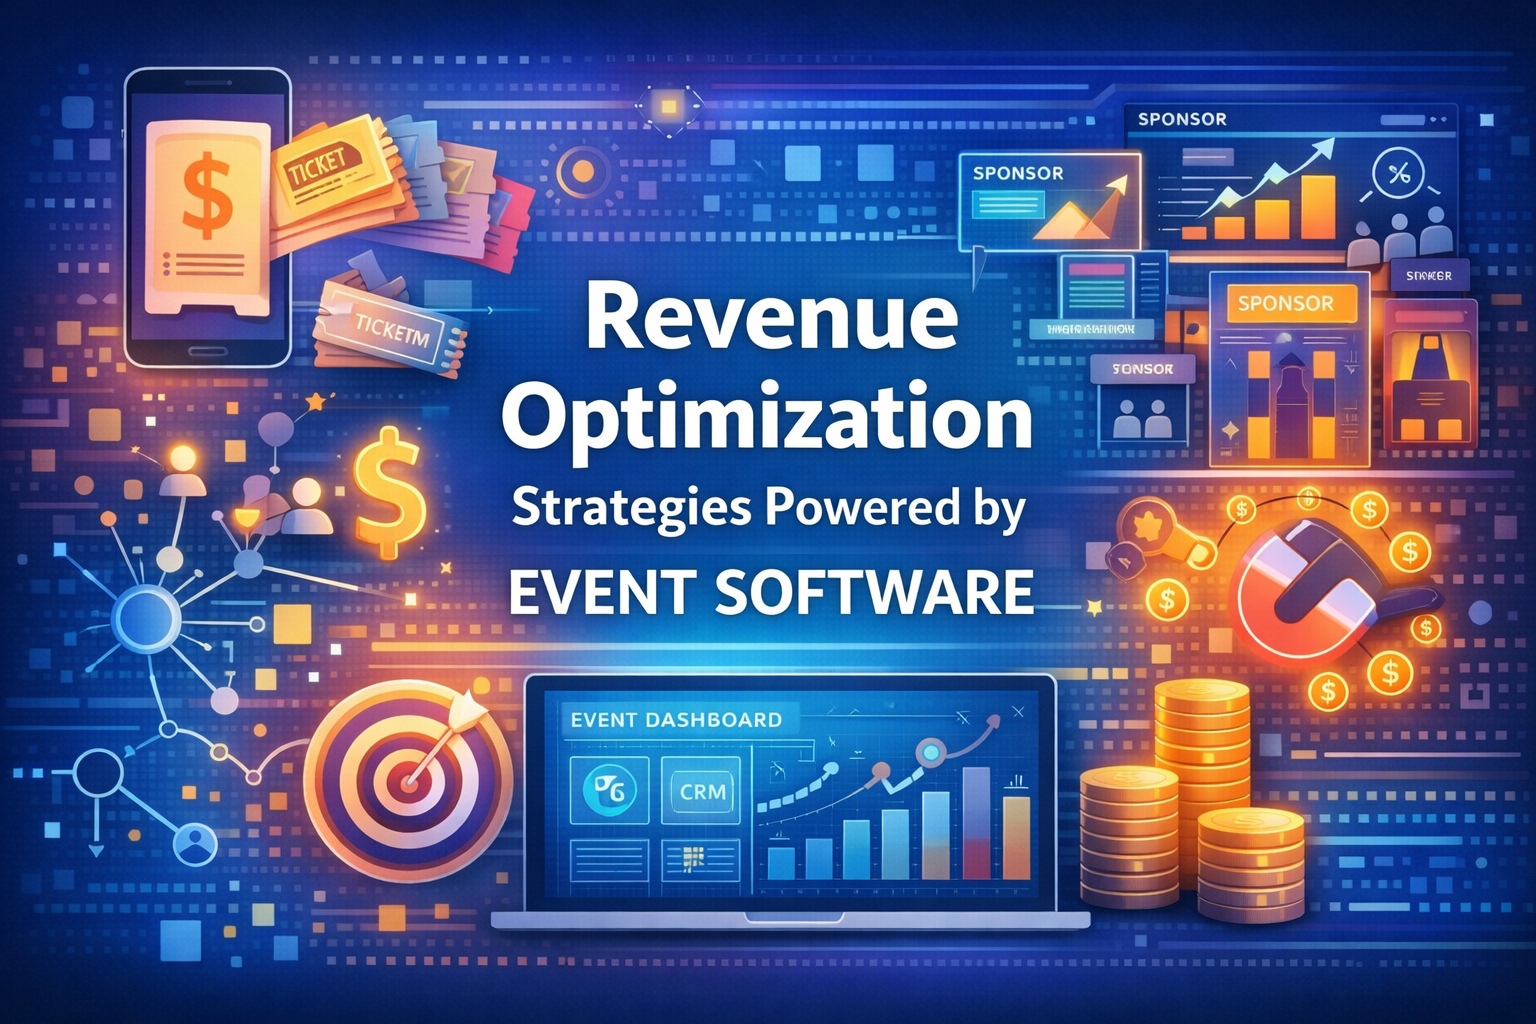
• Monitor ticket sales and revenue performance 💰
• Measure attendee engagement across sessions and activities 🎤
• Analyze sponsor and exhibitor participation 🤝
• Evaluate overall event success through defined objectives 🏆
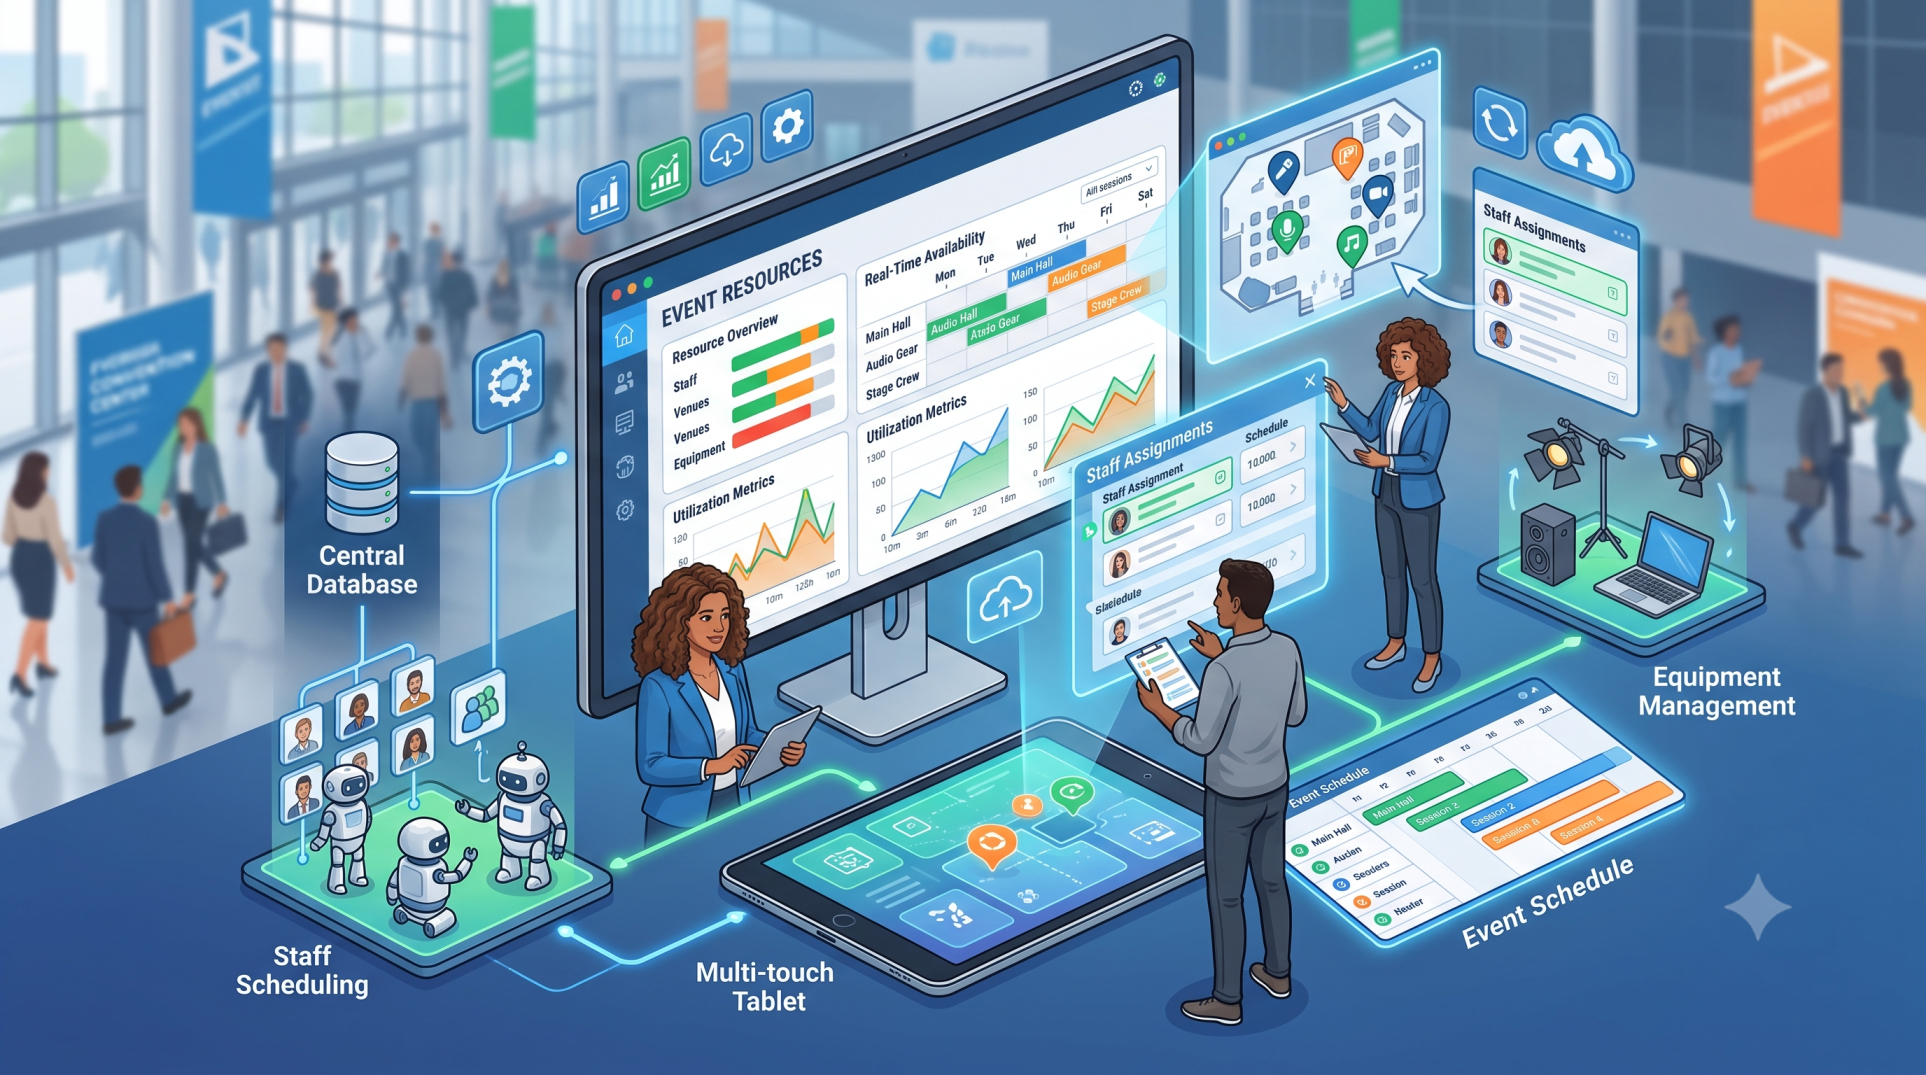
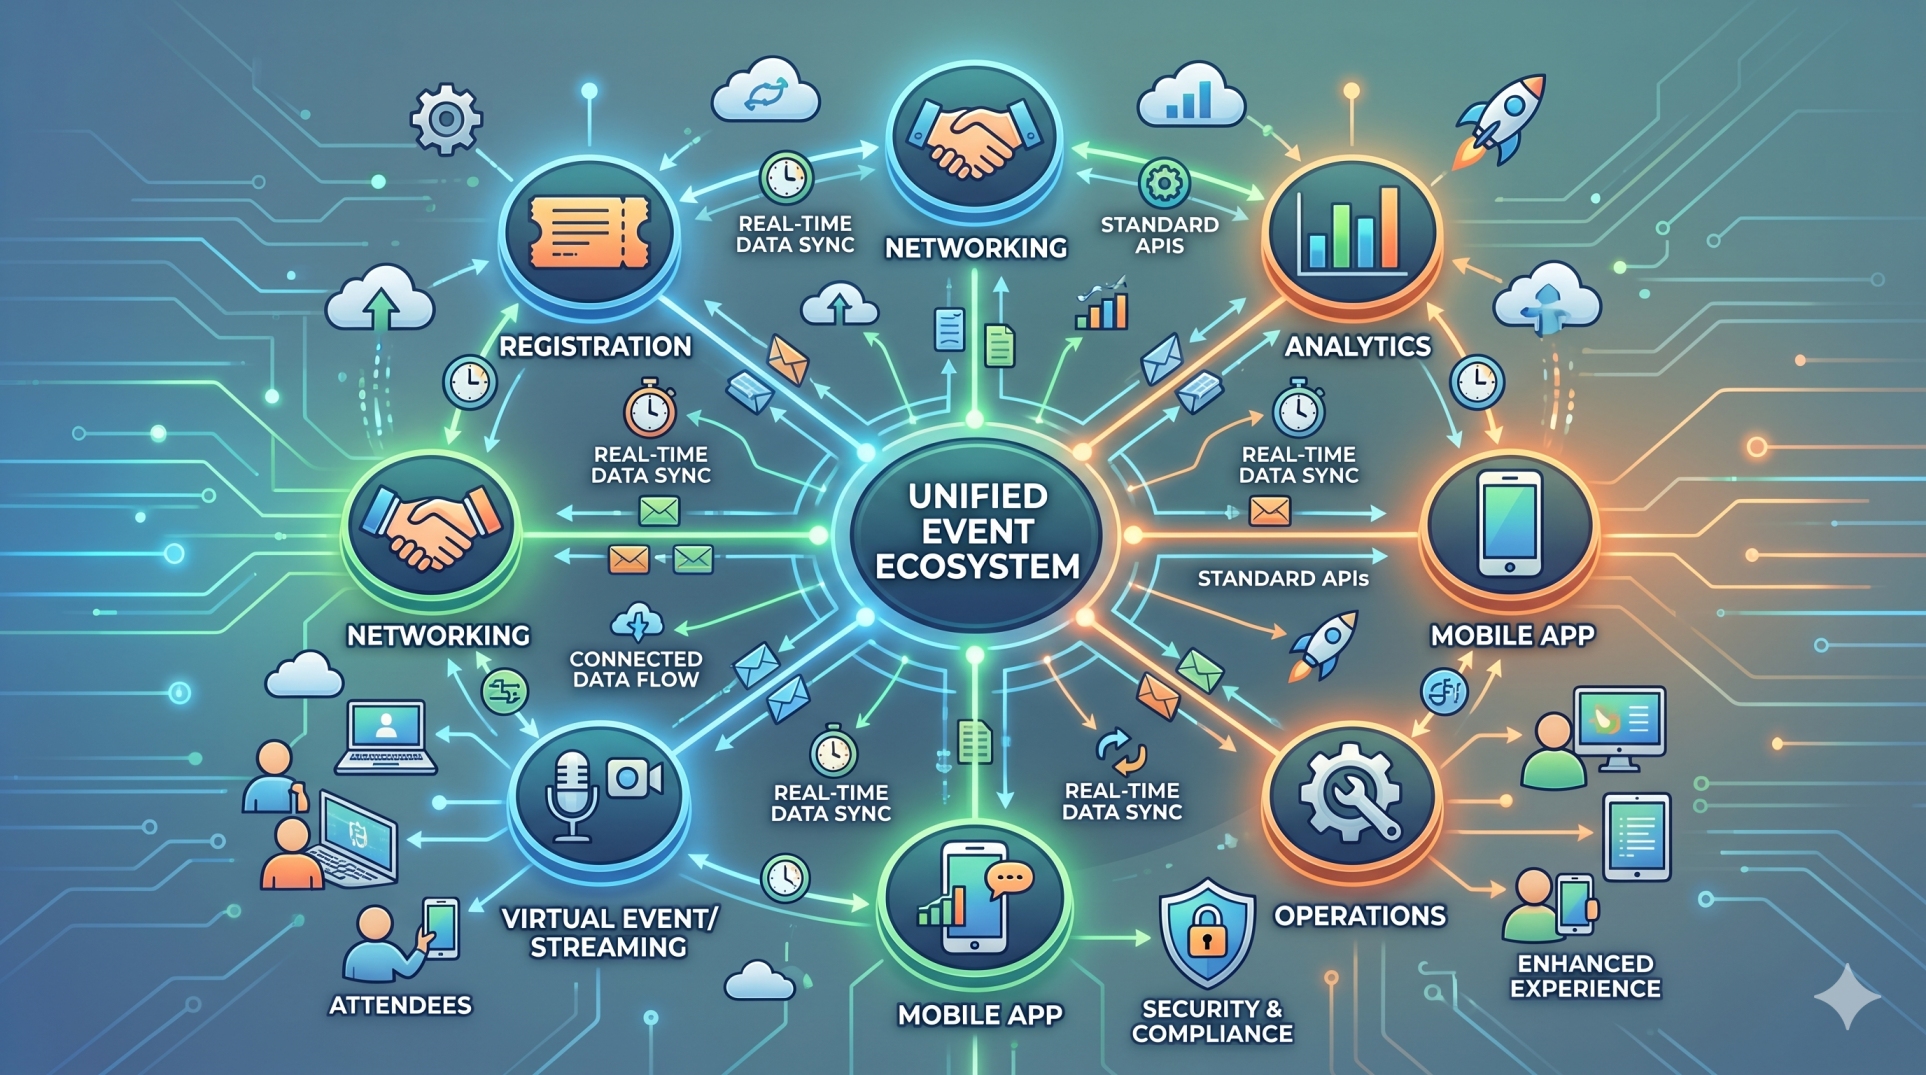
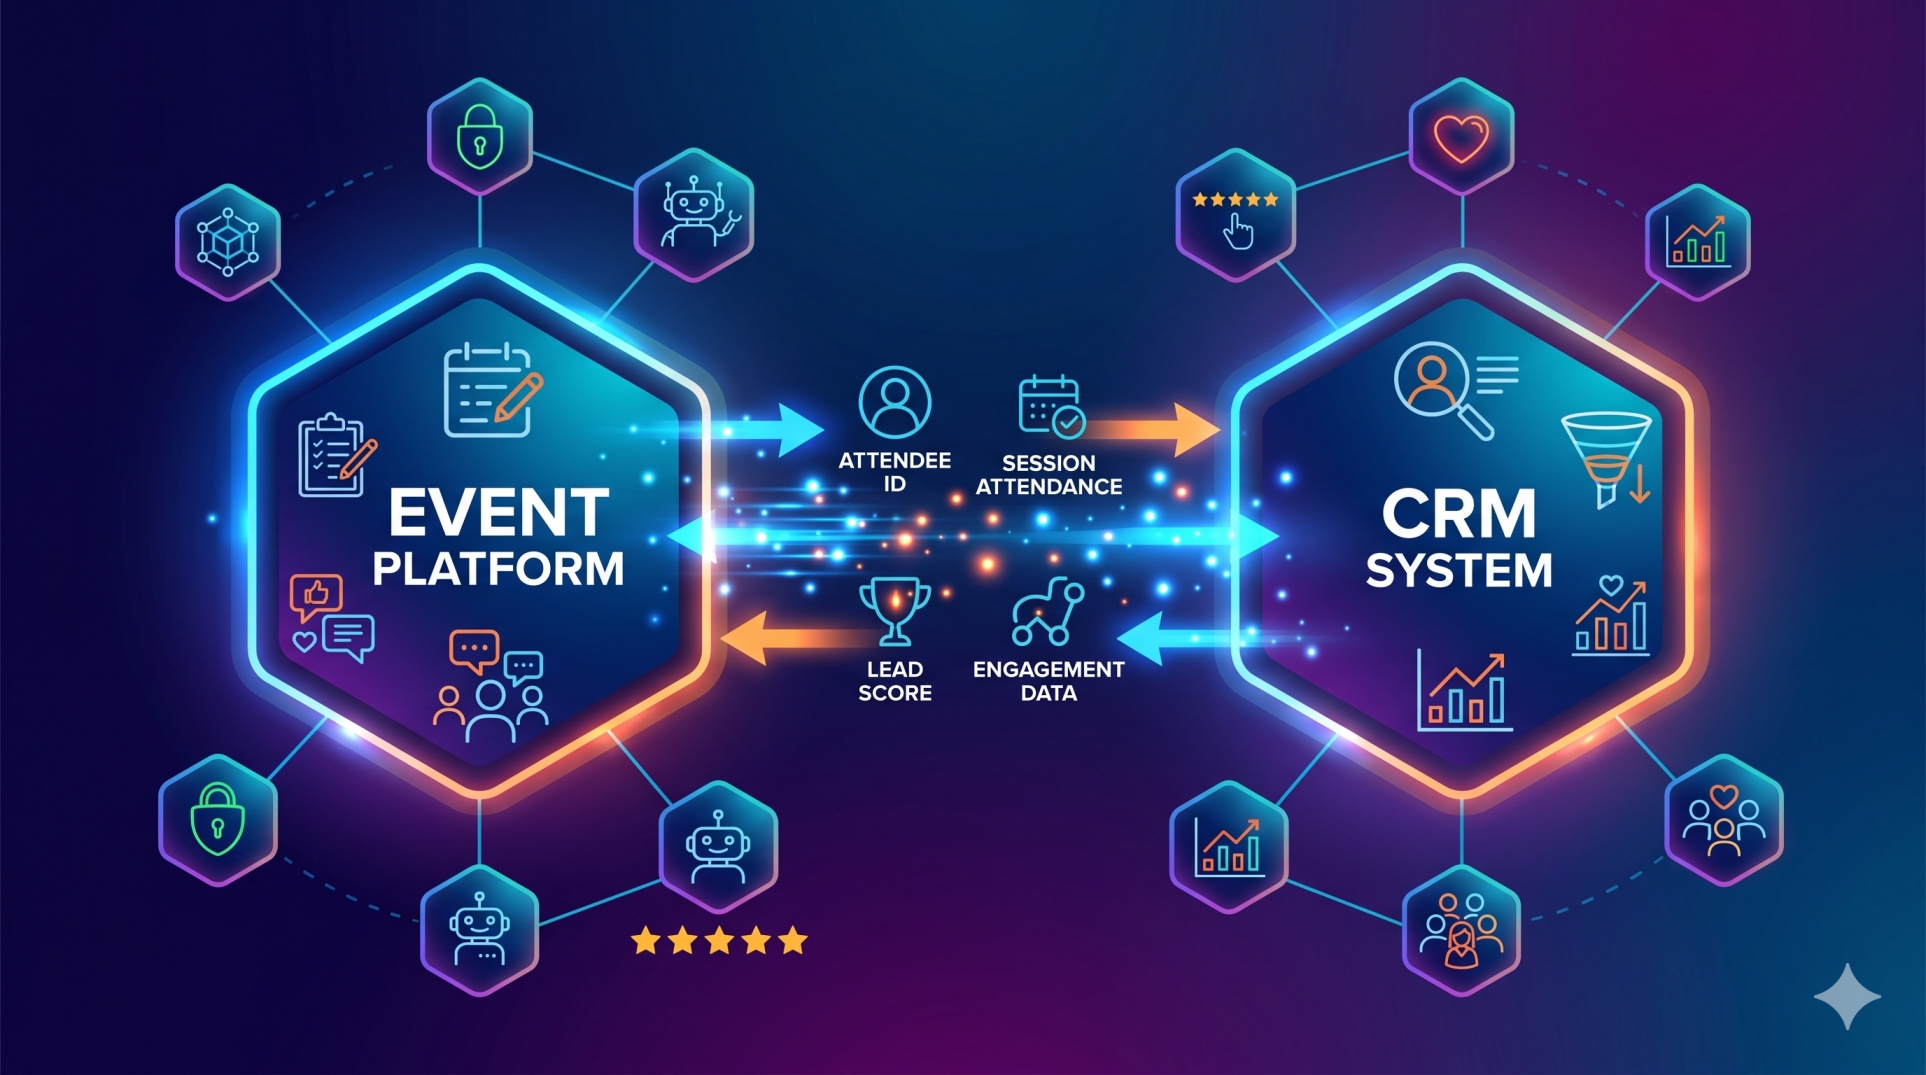
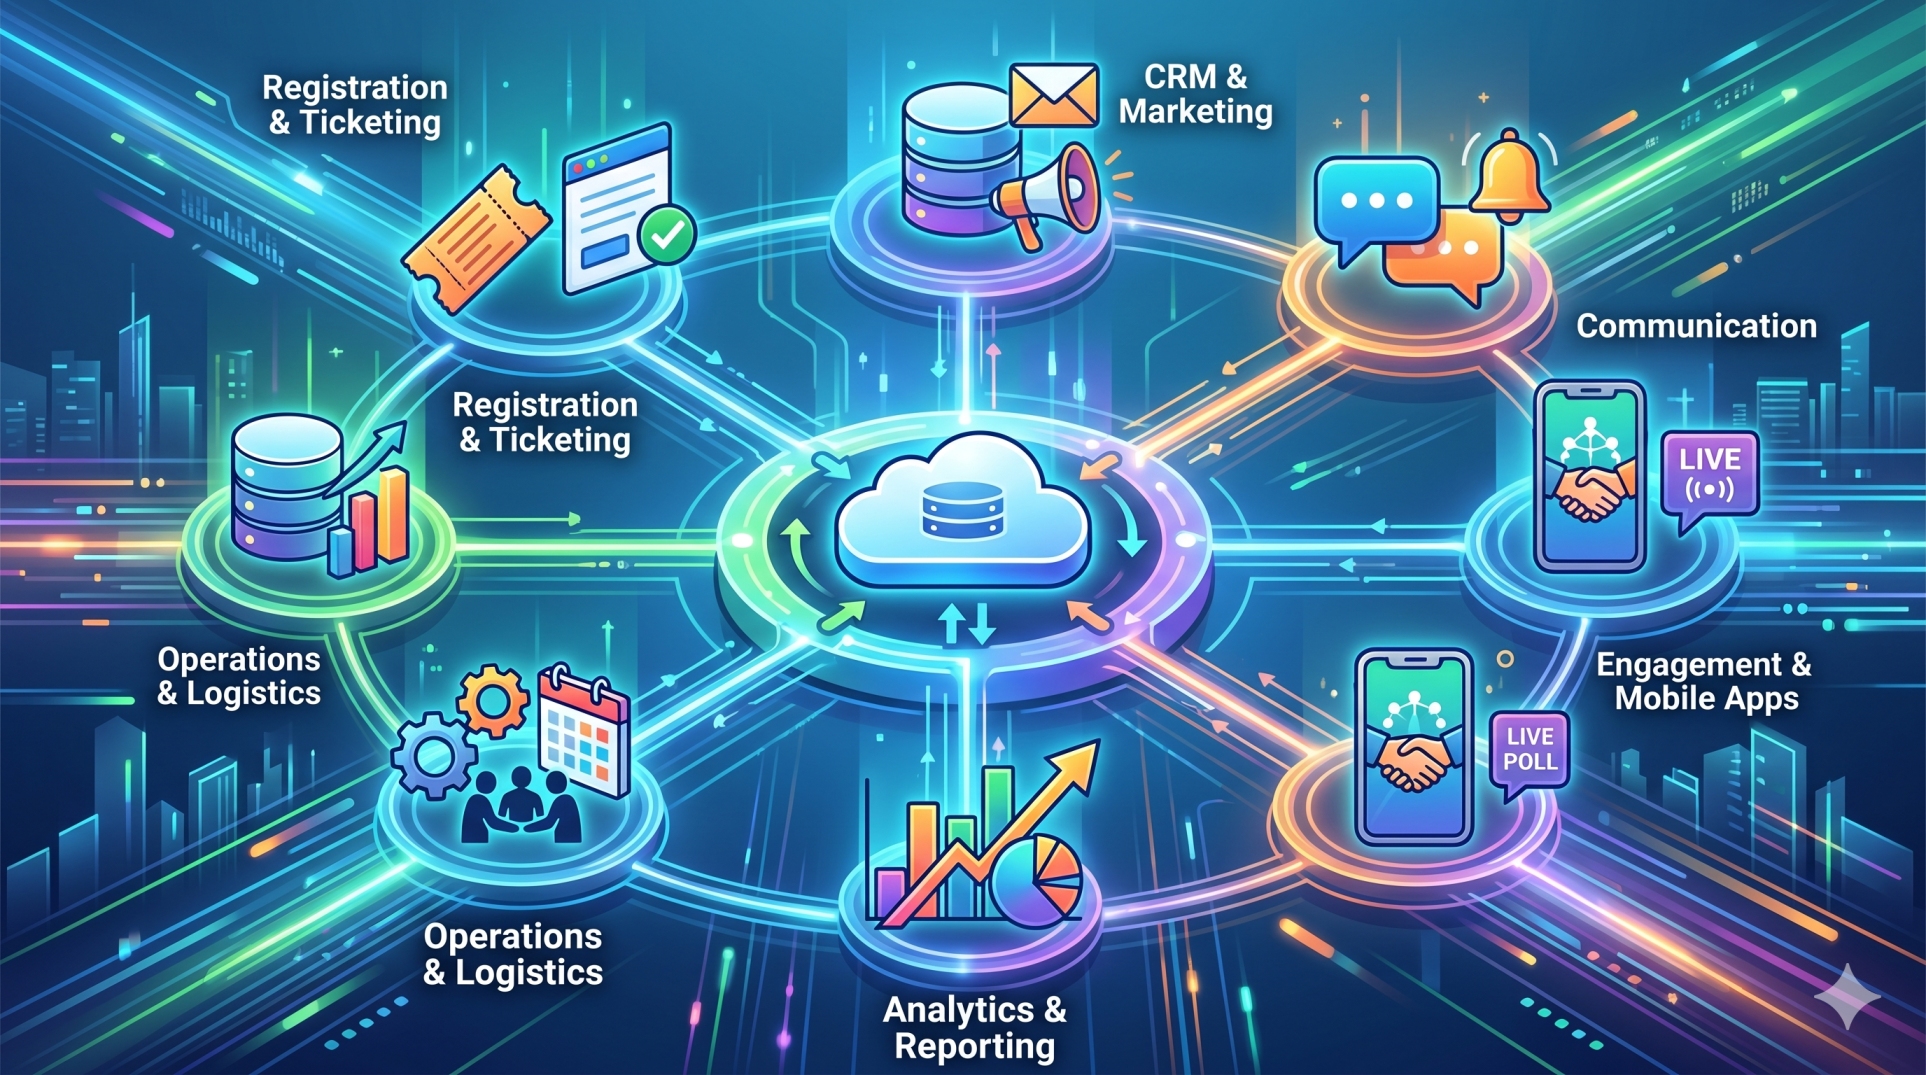
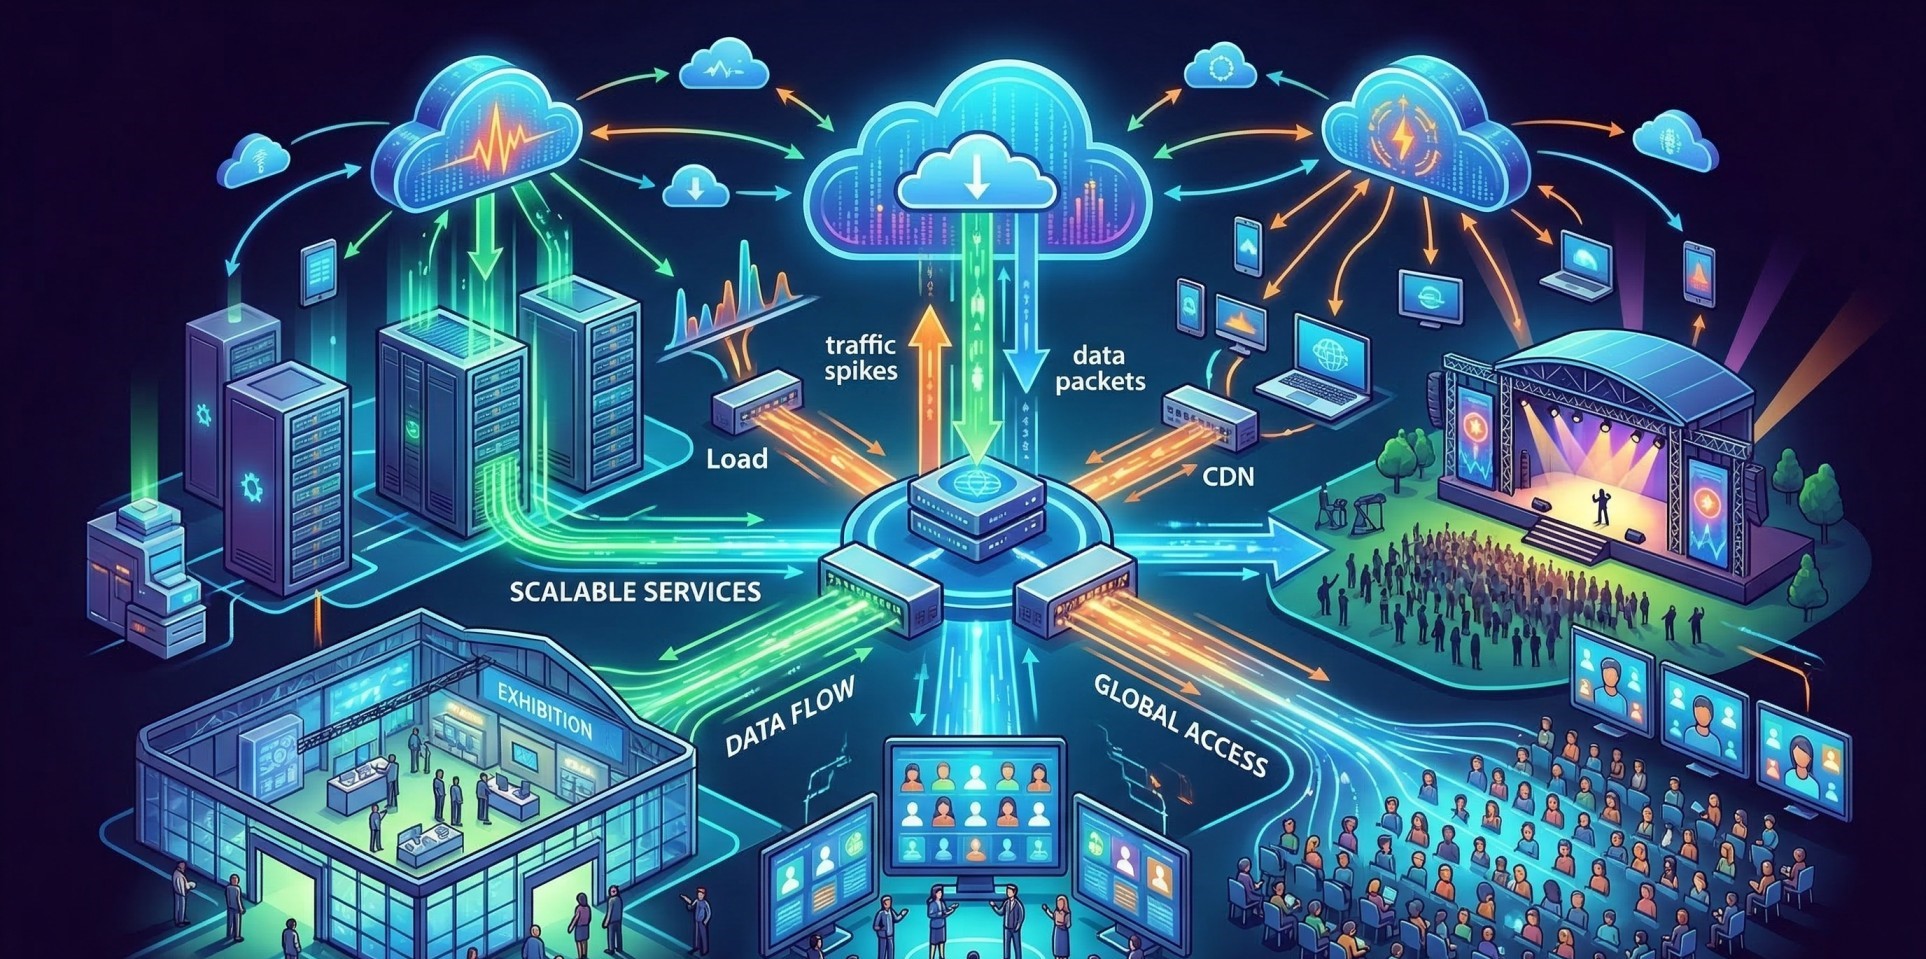
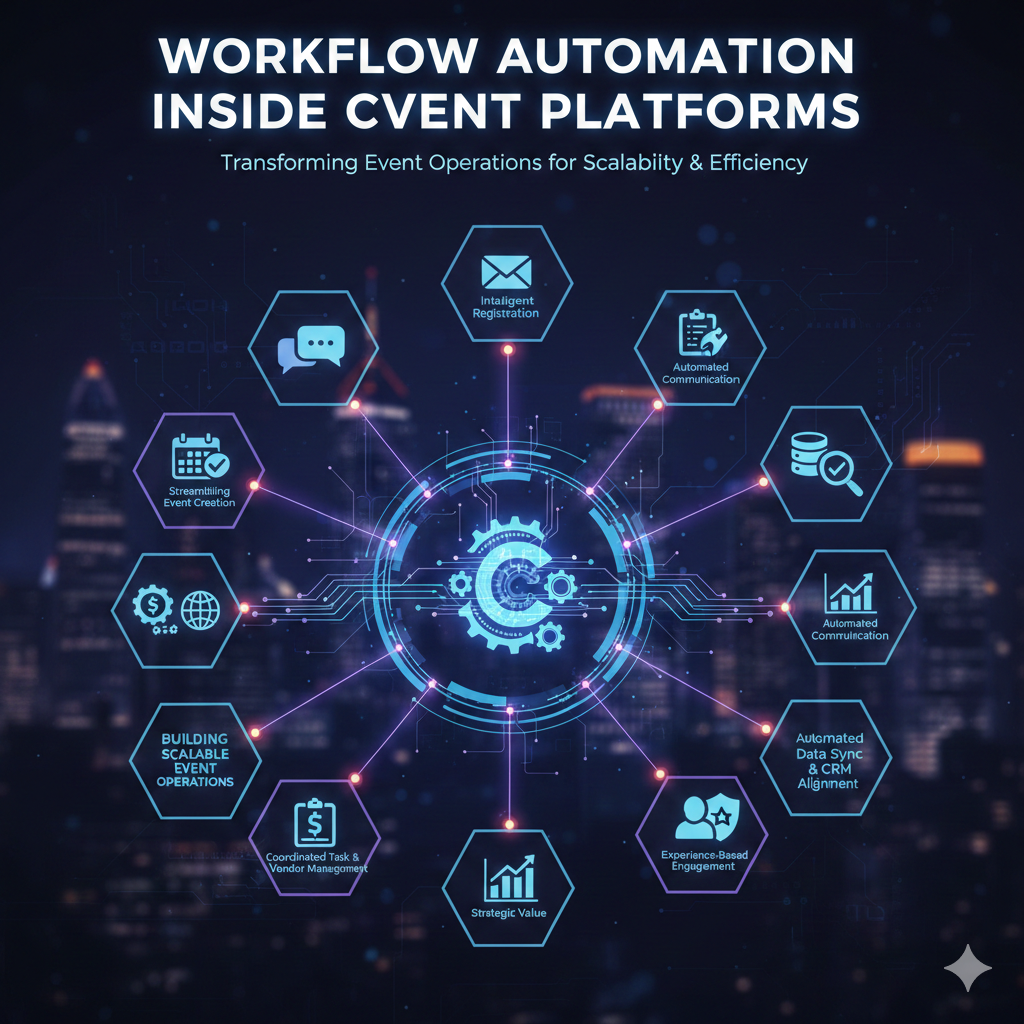
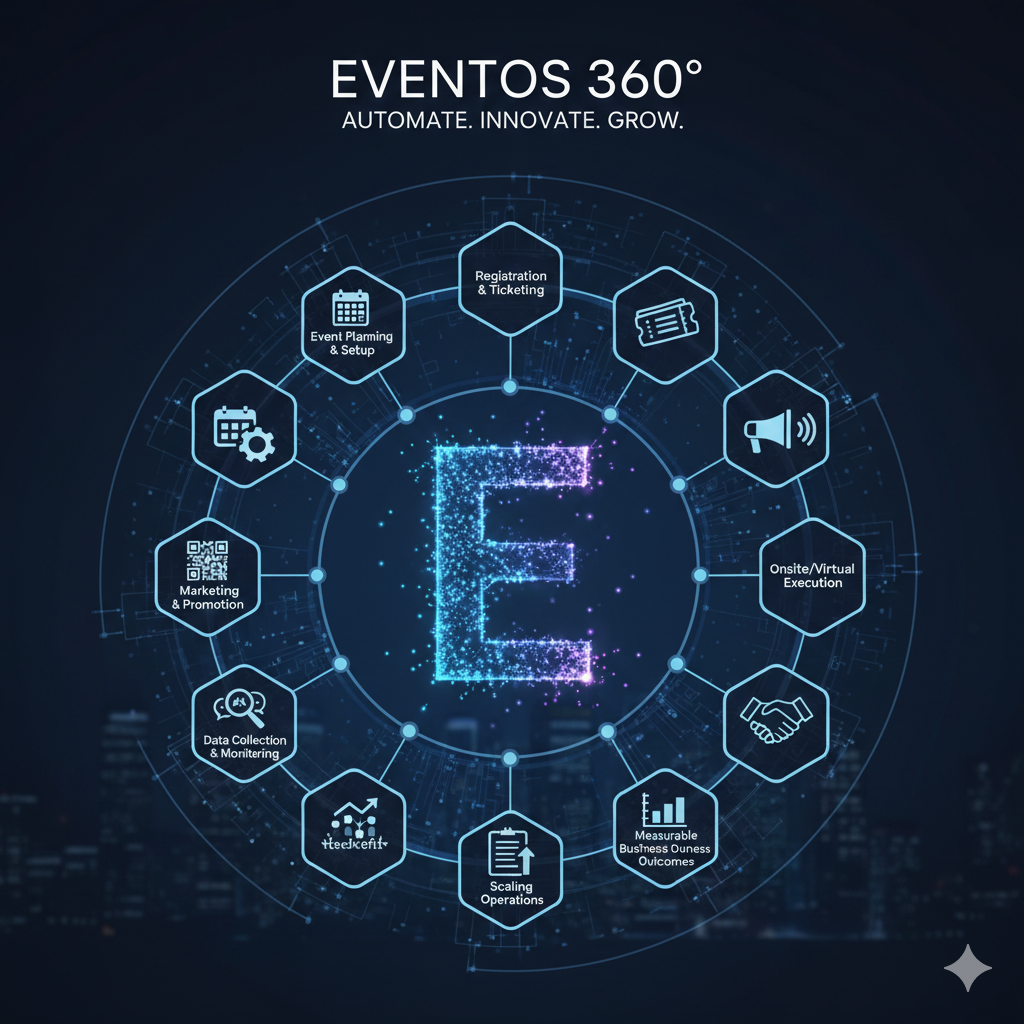
Step 3: Integrating Multiple Data Sources 🔄
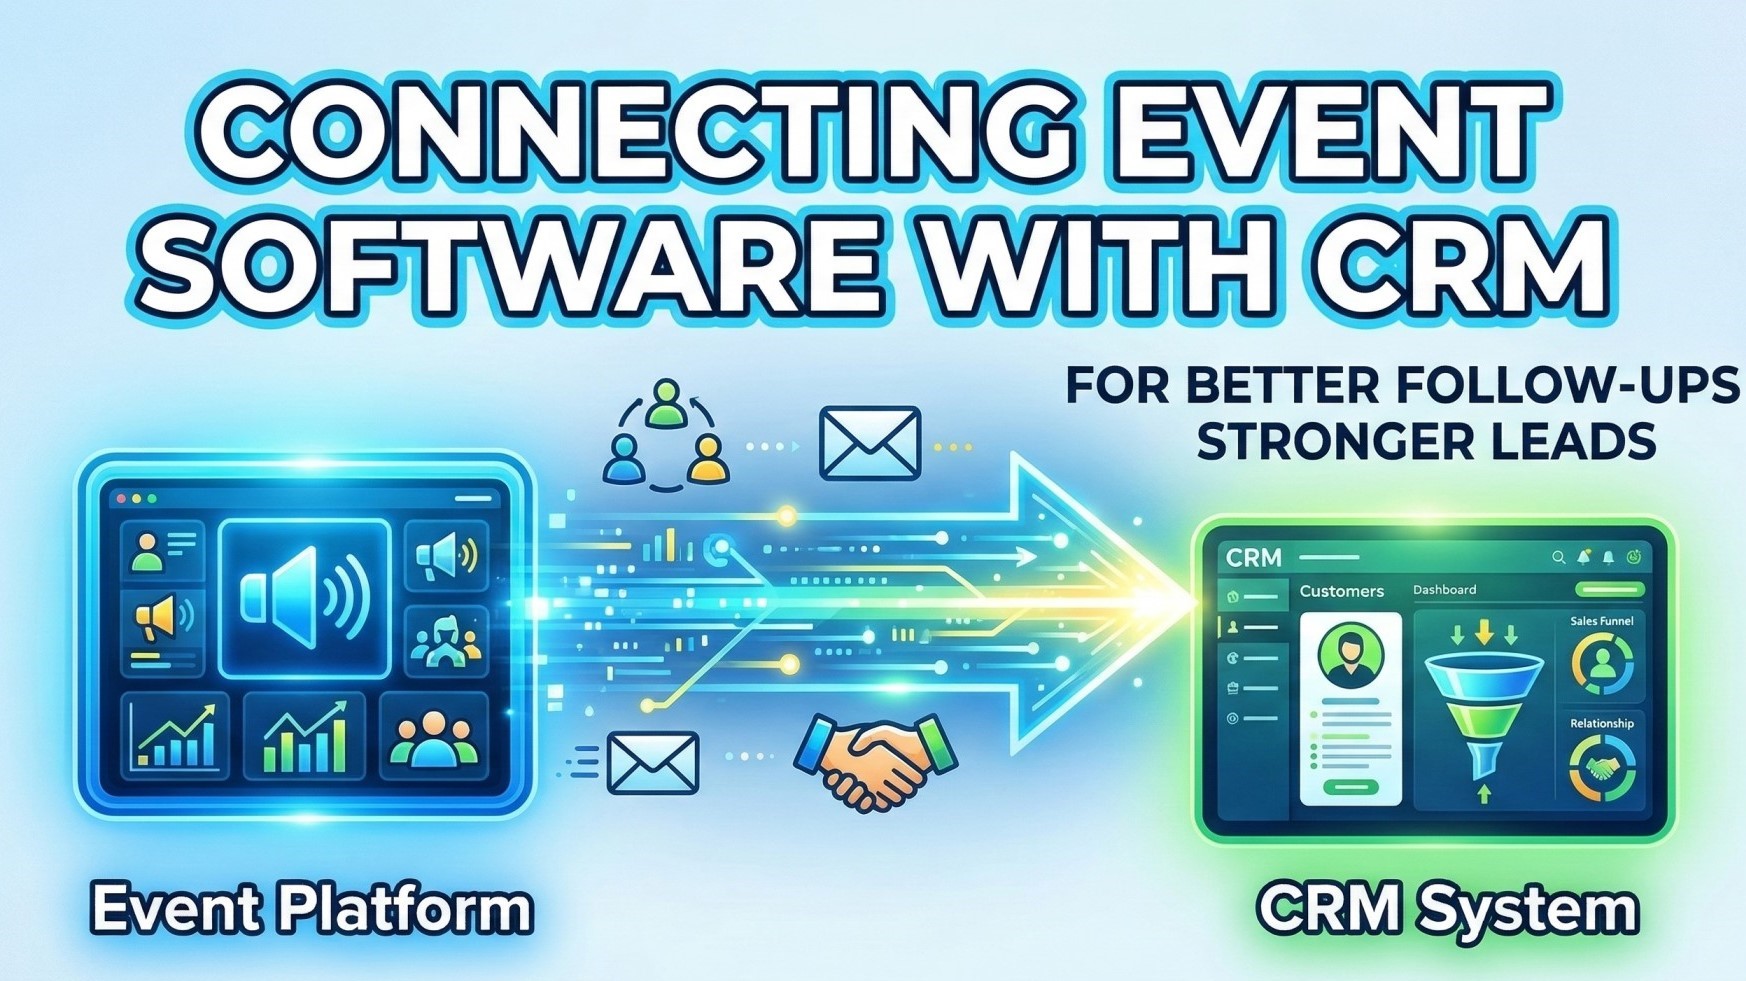
• Connect registration, ticketing, and CRM platforms 🔗
• Incorporate attendee engagement and networking data 📱
• Integrate survey responses and feedback systems 📝
• Collect information from mobile event applications 📡
• Consolidate data into a centralized analytics environment 🏢
Step 4: Designing Effective Dashboard Layouts 🎨
• Organize metrics based on business priorities 📋
• Use intuitive visualizations for quick understanding 📊
• Highlight critical KPIs with prominent placement ⭐
• Reduce clutter to improve usability and focus 🎯
• Ensure dashboards are accessible across devices 💻
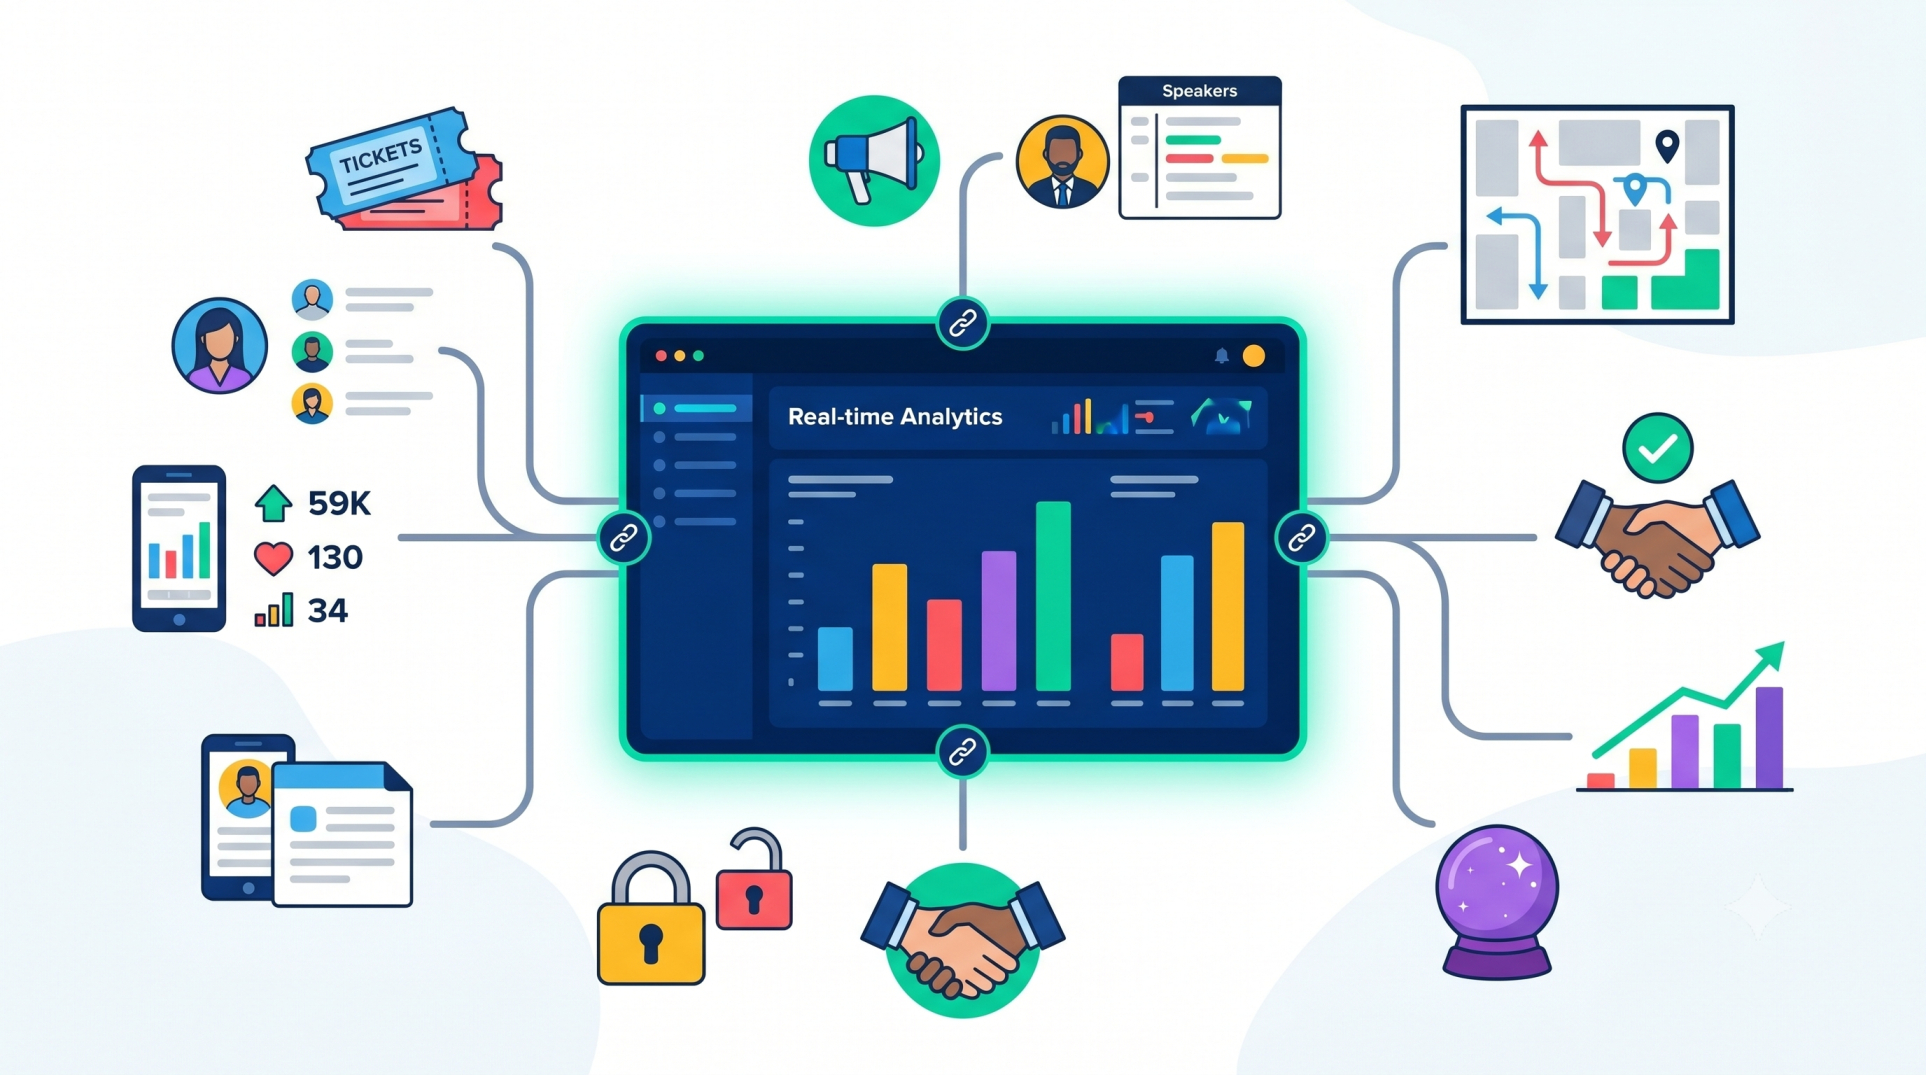
Step 5: Monitoring Real-Time Event Performance ⏱️
• Track attendee check-ins and venue occupancy in real time 🚪
• Monitor session attendance and participation levels 🎤
• Identify operational issues before they escalate 🚨
• Measure engagement trends throughout the event 📈
• Support immediate decision-making with live insights ⚡
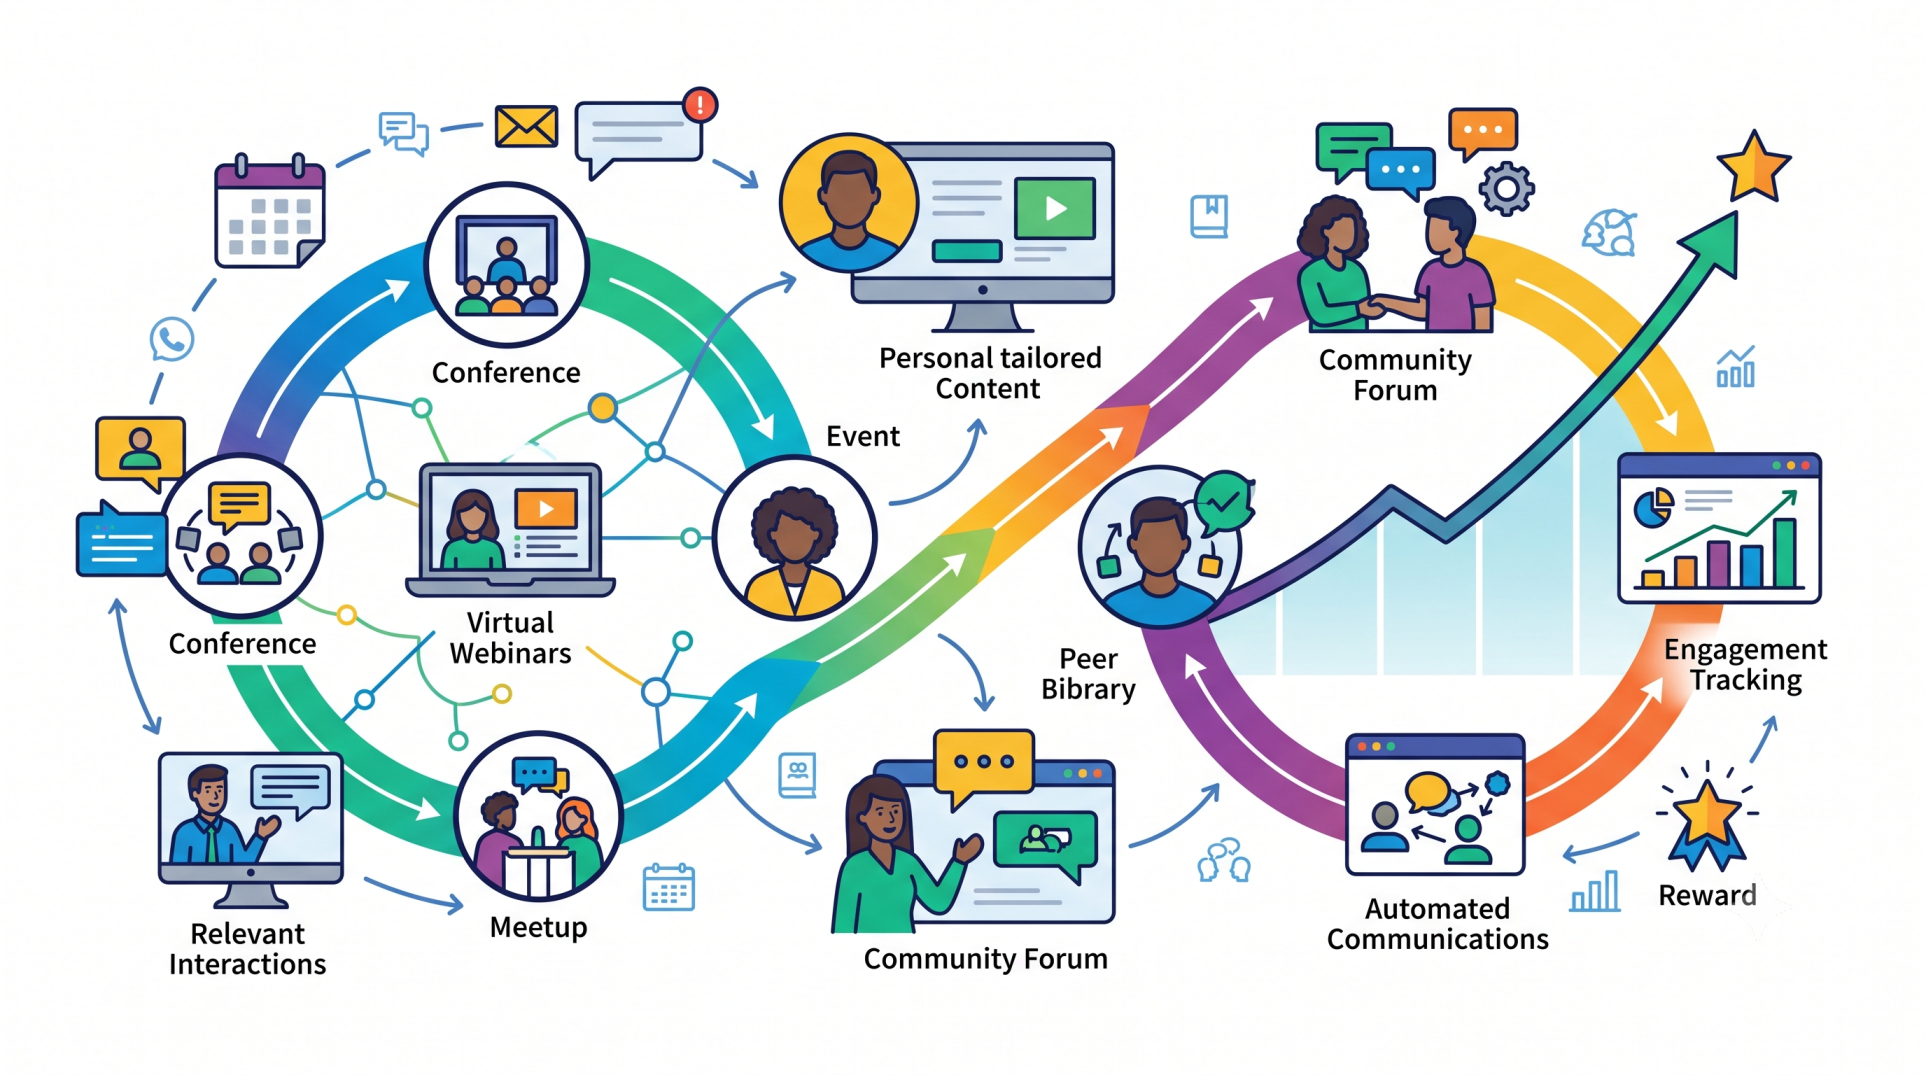
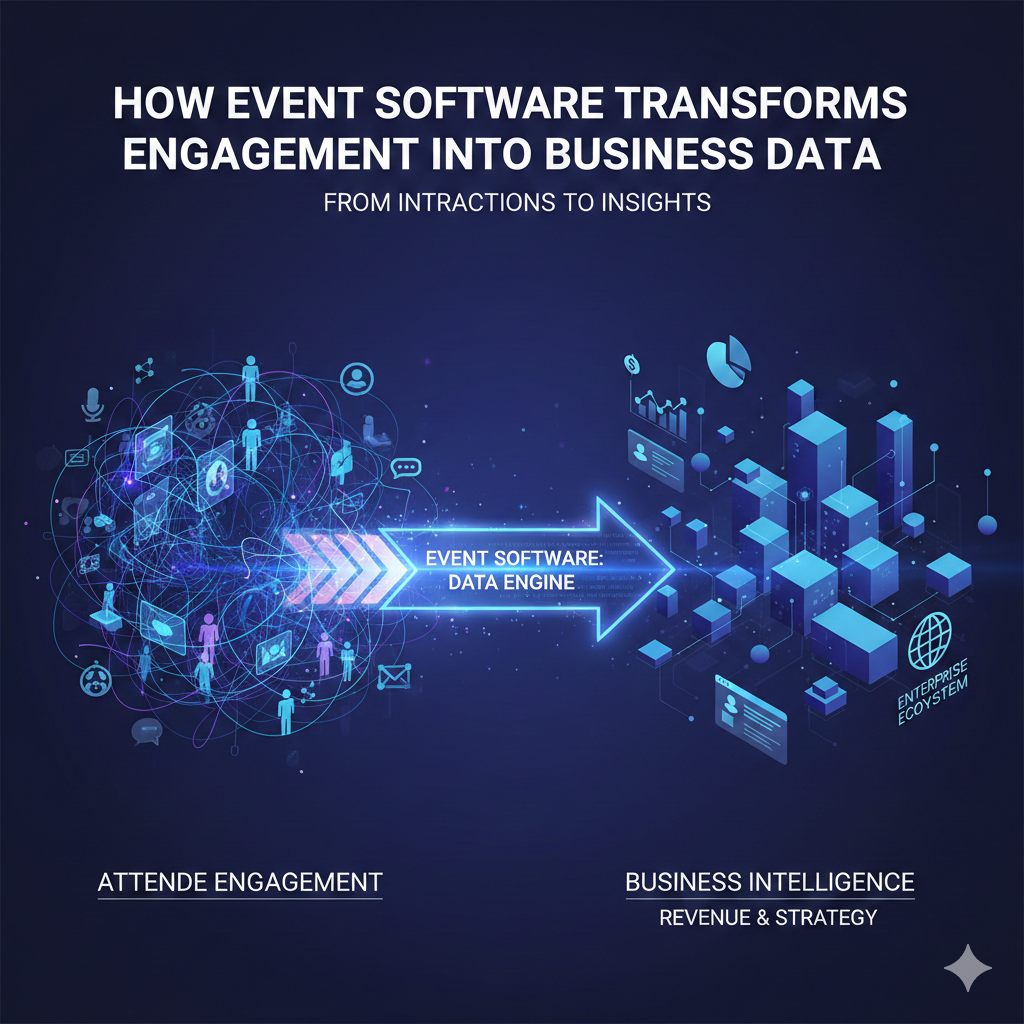
Step 6: Analyzing Attendee Behavior 🧑💼
• Understand attendee movement and participation patterns 🚶
• Identify the most popular sessions and activities 🌟
• Measure networking and interaction levels 🤝
• Track content consumption across event channels 📺
• Discover opportunities to improve future experiences 💡
Step 7: Evaluating Sponsor and Exhibitor Performance 🏢
• Monitor booth traffic and visitor engagement 👥
• Measure lead generation and interaction quality 📋
• Track sponsor visibility across event platforms 📢
• Analyze return on investment for exhibitors 💰
• Provide data-driven reports to stakeholders 📊
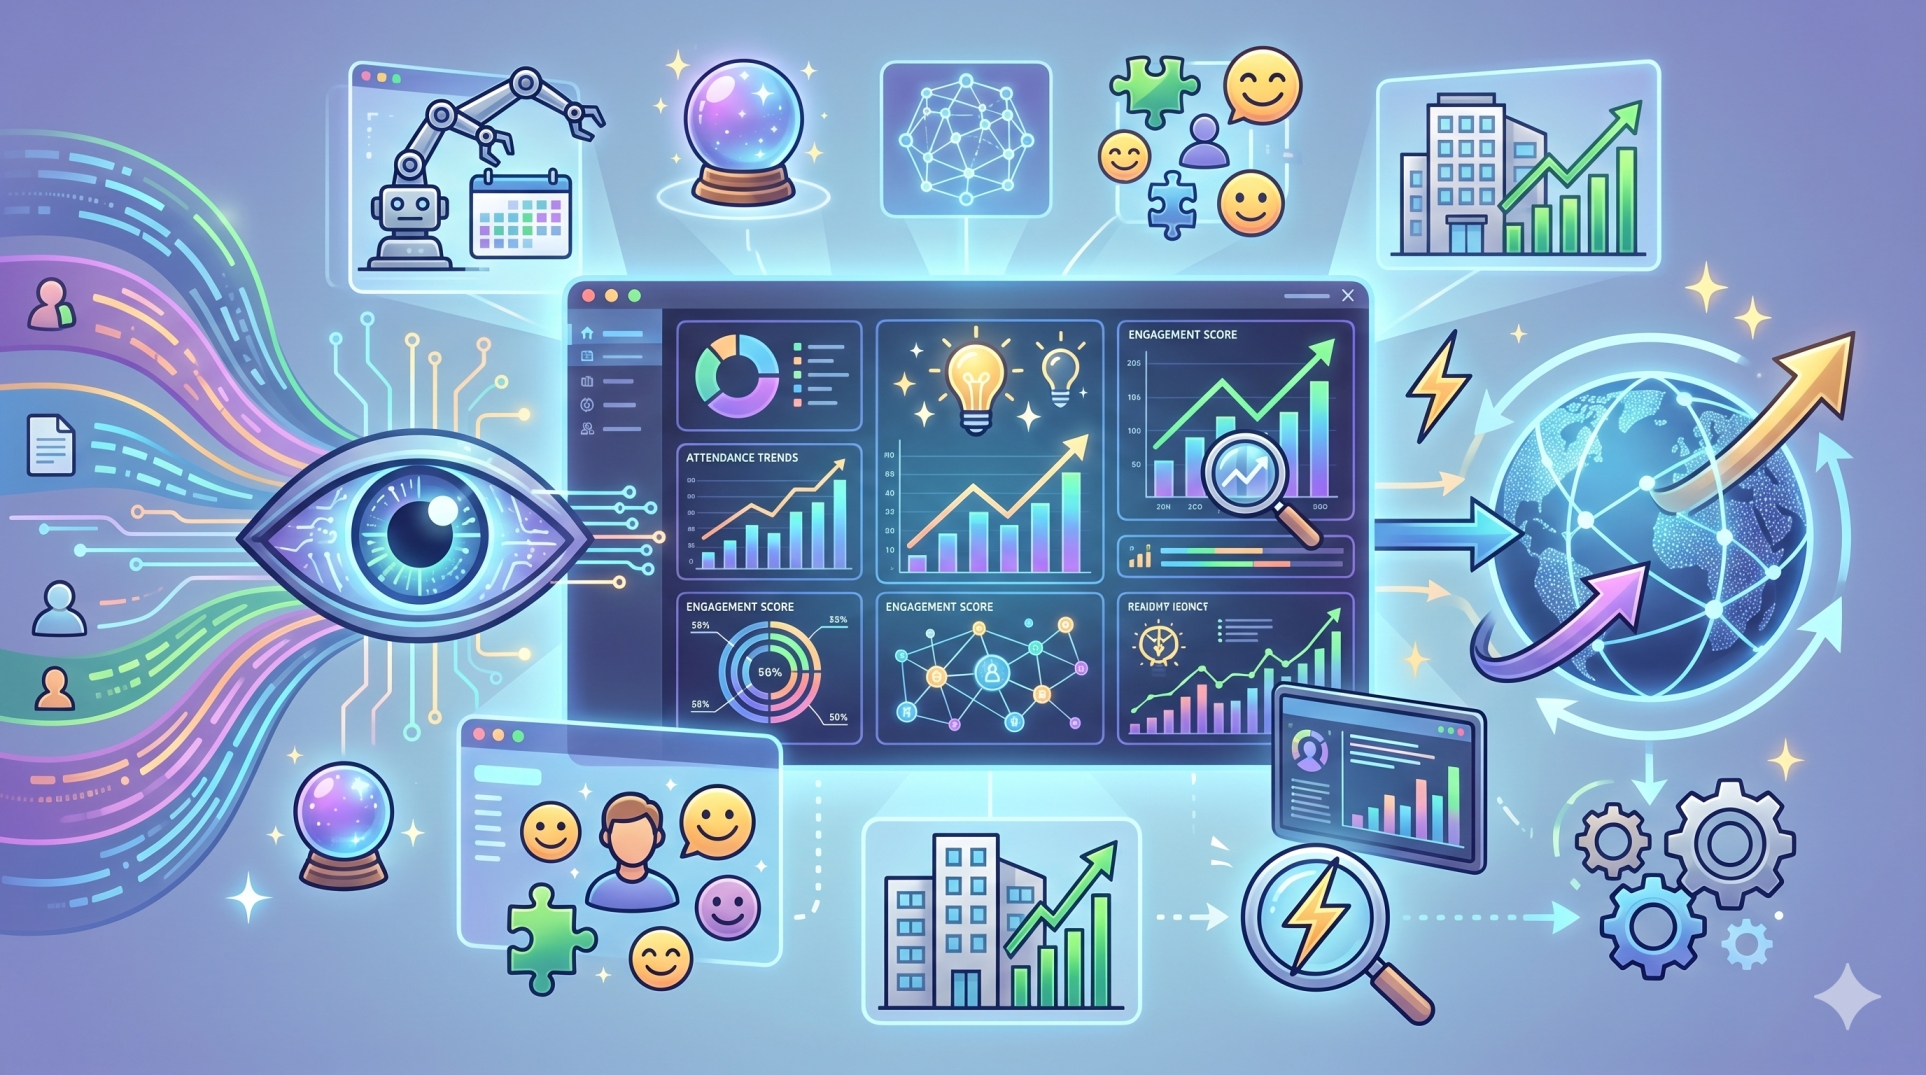
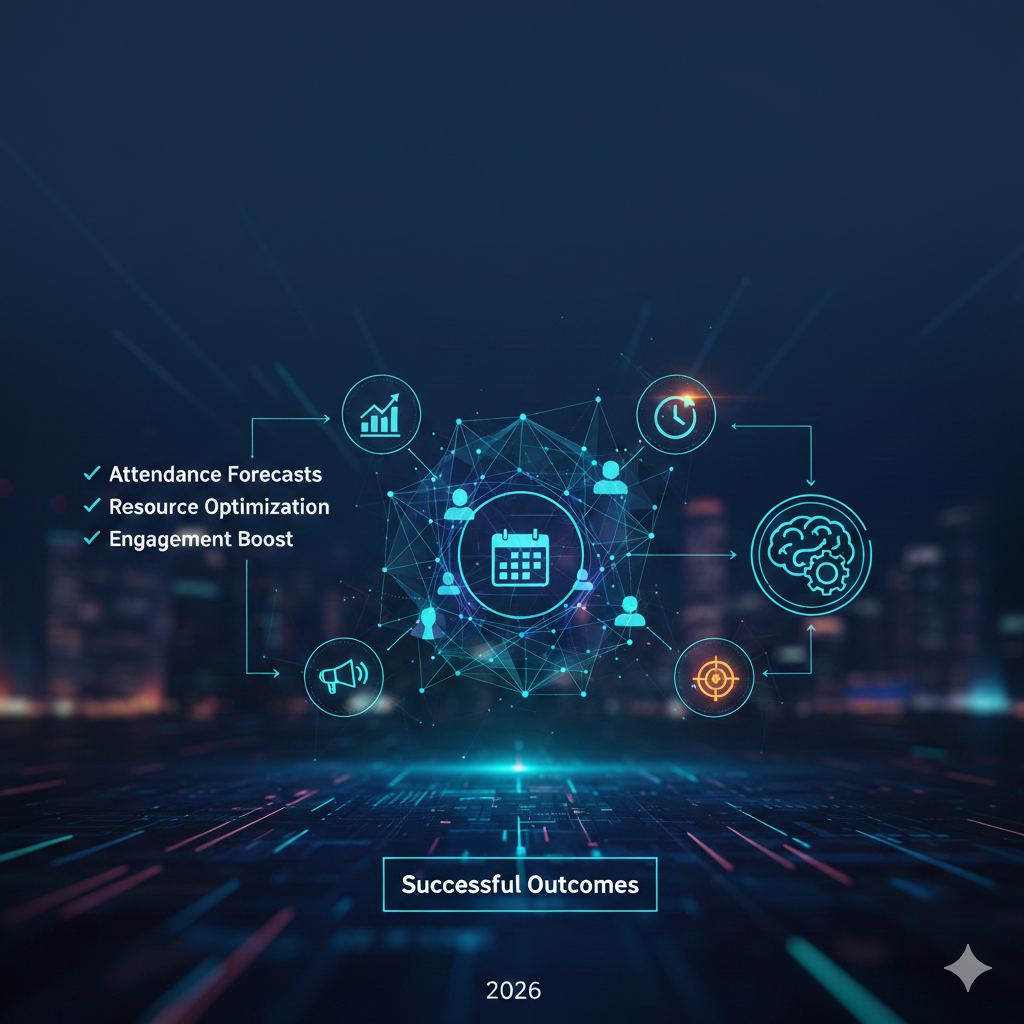
Step 8: Implementing Predictive Analytics 🔮
• Forecast attendance trends and resource requirements 📈
• Predict session demand and capacity needs 🎟️
• Identify potential operational bottlenecks early ⚠️
• Support proactive planning and optimization 🛠️
• Improve event outcomes through data-driven forecasting 🎯
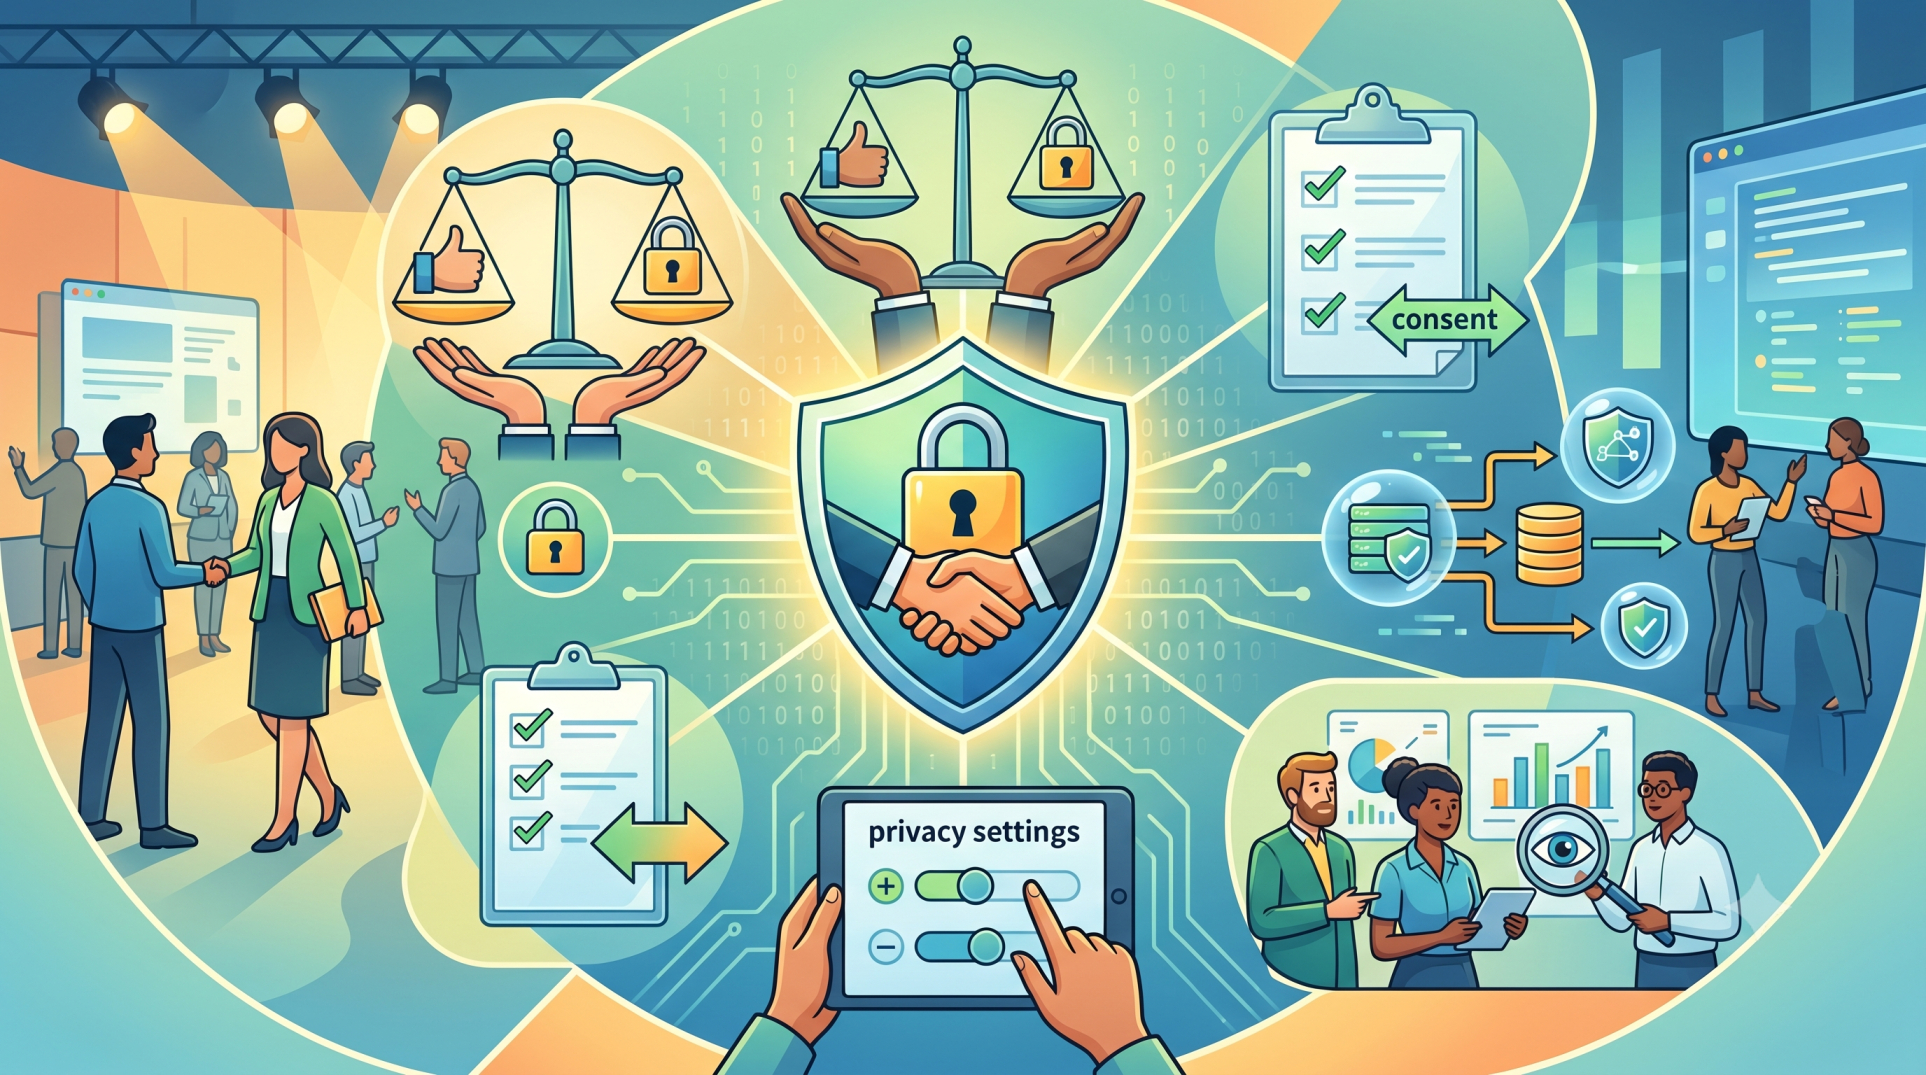
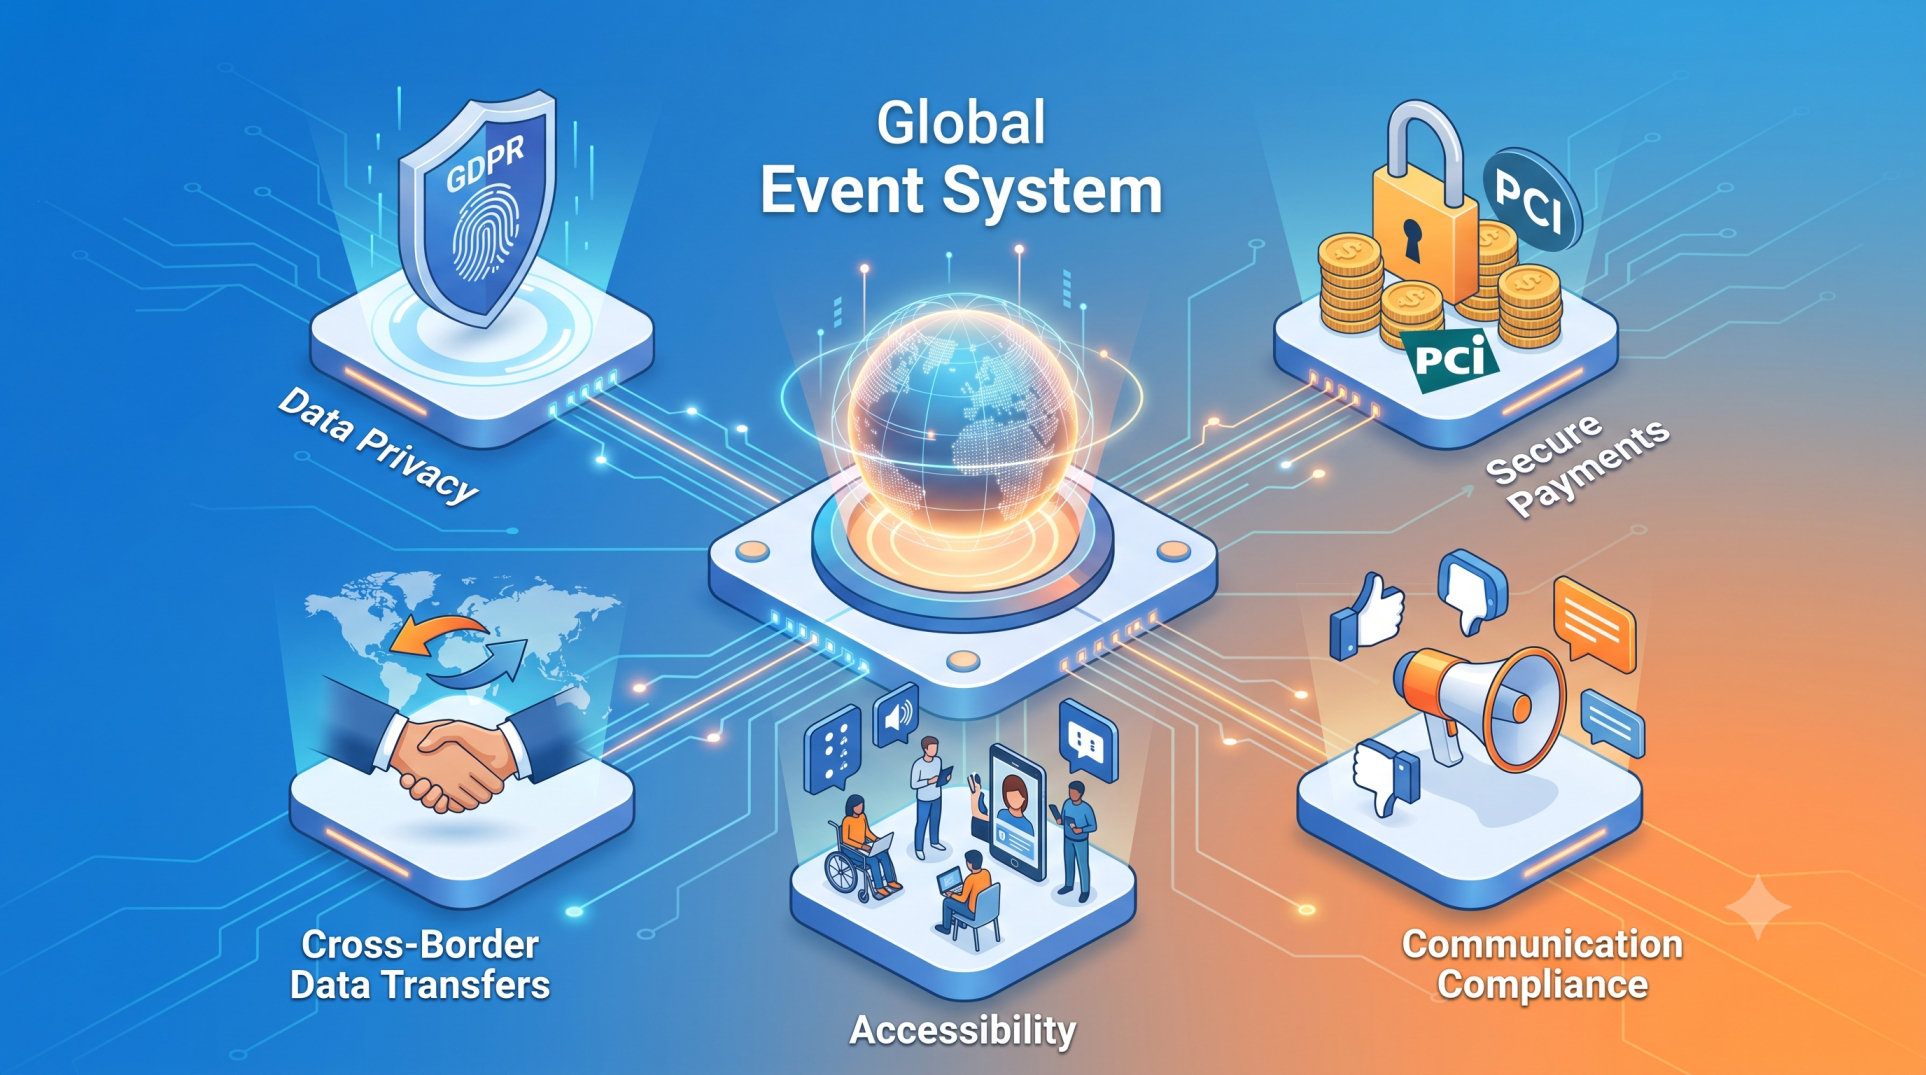
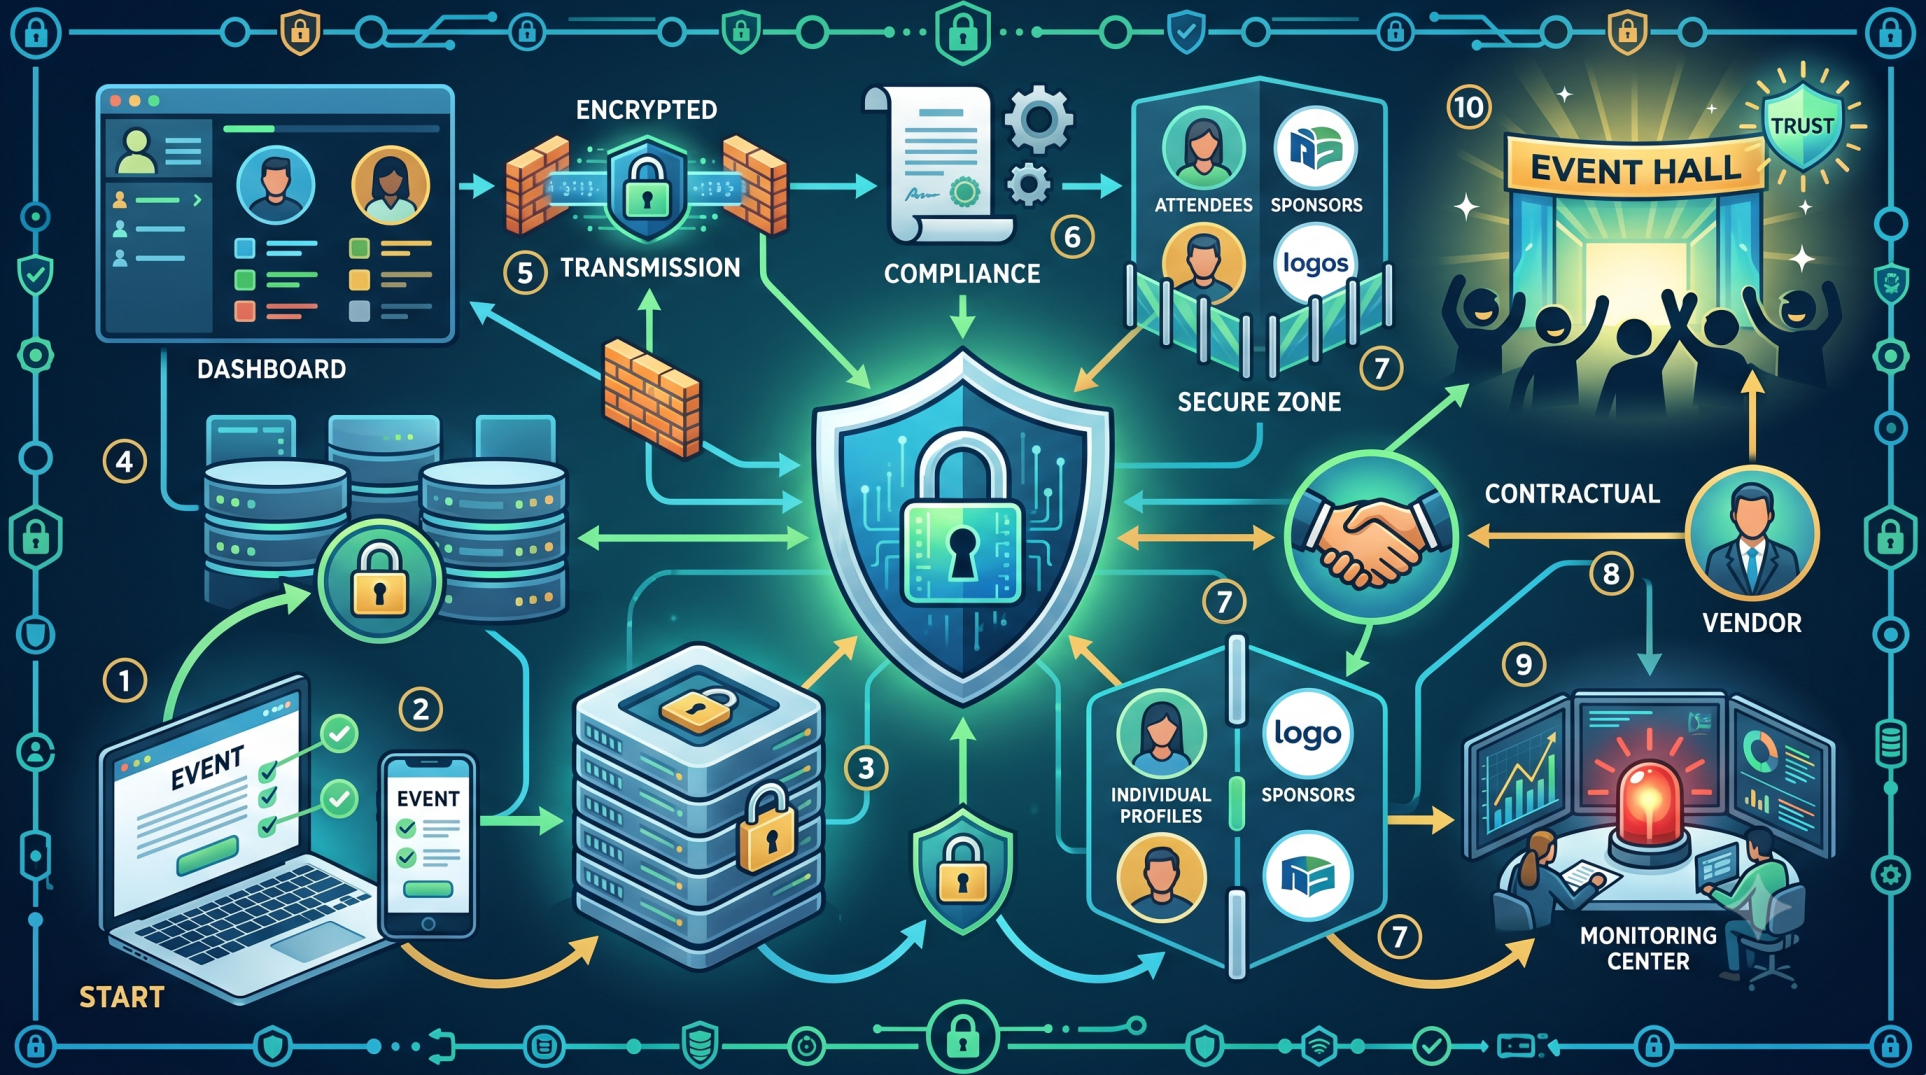
Step 9: Ensuring Data Security and Governance 🔐
• Protect attendee and organizational information 🛡️
• Apply role-based access controls 👤
• Maintain compliance with privacy regulations 📜
• Ensure data accuracy and consistency across systems ✔️
• Establish governance policies for dashboard management ⚖️
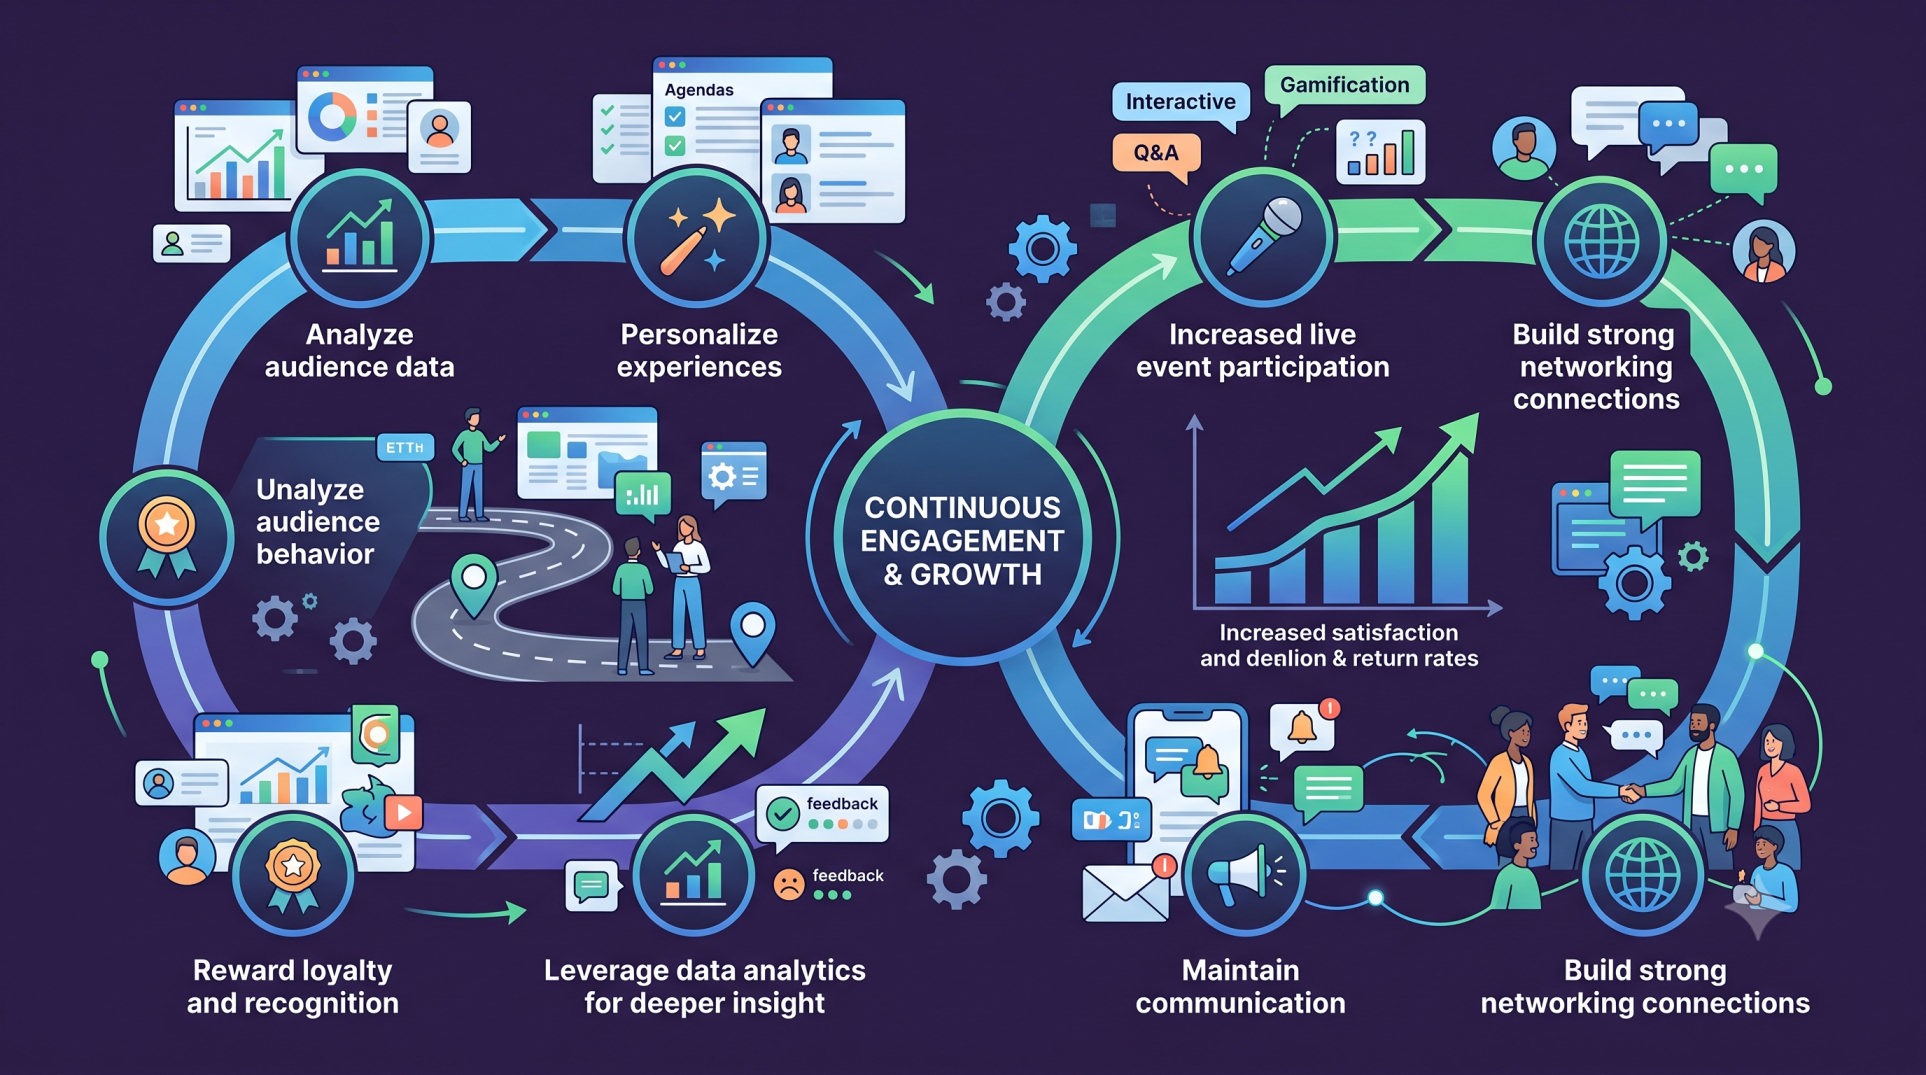
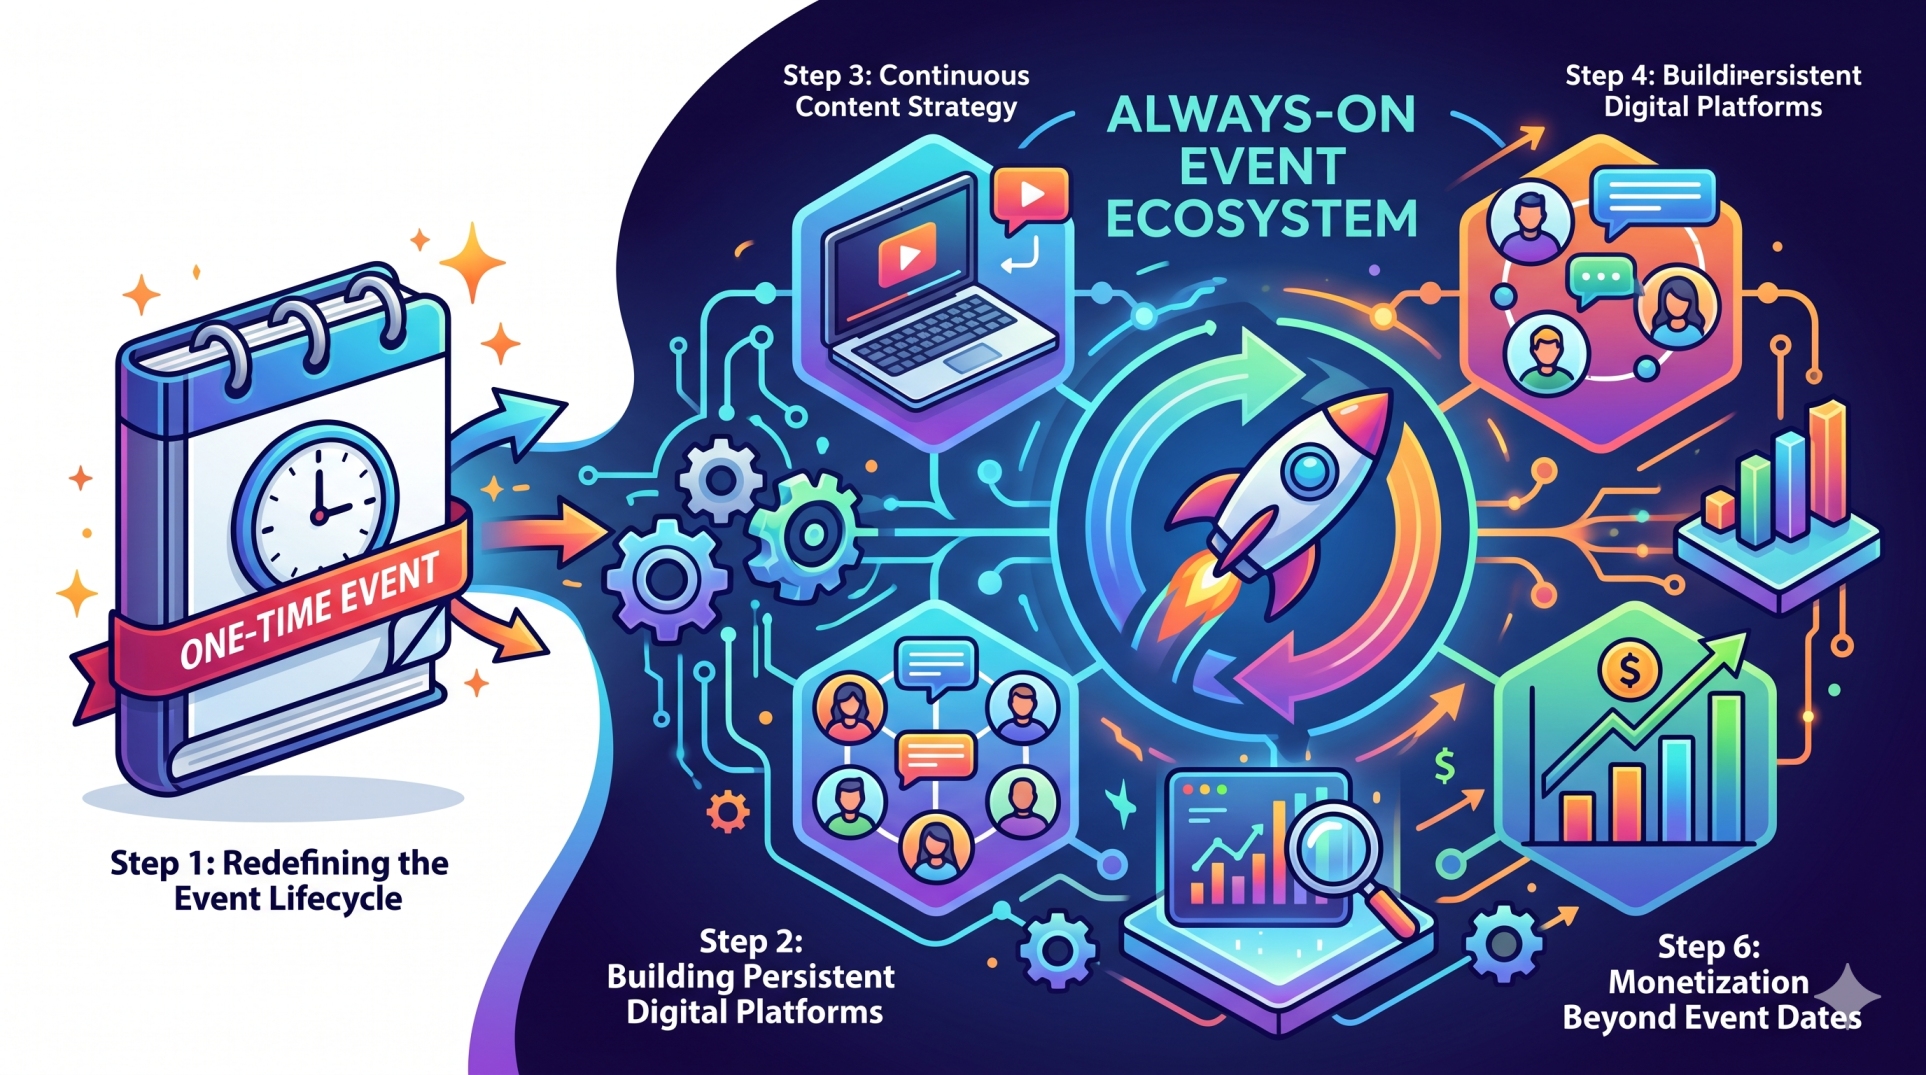
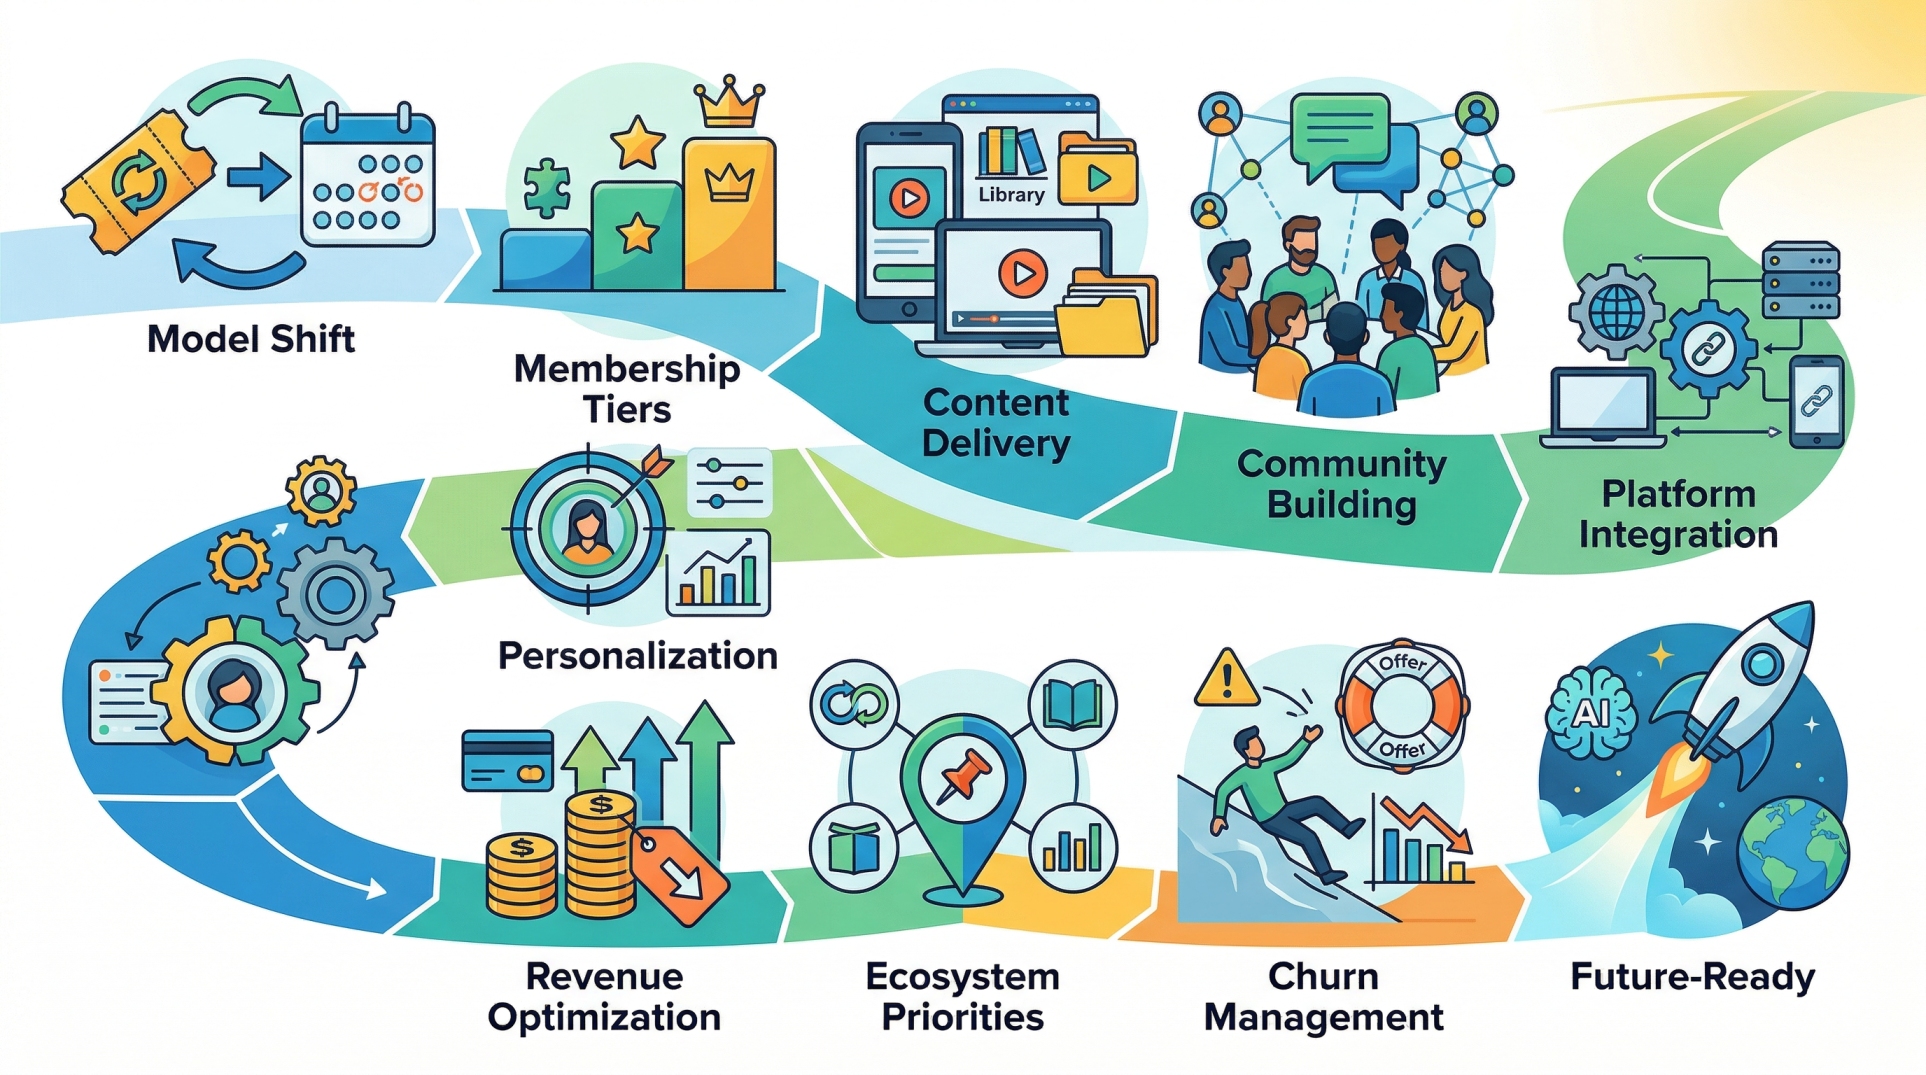
Step 10: Driving Continuous Event Improvement 🚀
• Compare performance across multiple events 📊
• Identify strengths and areas for enhancement 🔍
• Measure progress against strategic goals 🎯
• Use insights to refine planning and execution processes 🛠️
• Create a culture of continuous optimization and innovation 🌟
Conclusion
Building Event Intelligence Dashboards enables organizations to transform event data into meaningful business insights. By integrating information from multiple sources, monitoring performance in real time, and leveraging advanced analytics, event teams can make informed decisions that enhance attendee experiences and improve operational efficiency. A well-designed dashboard becomes a strategic asset that supports smarter planning, stronger engagement, and long-term event success.
See more blogs
You can all the articles below


Ready to Find Your Perfect Solution?
Let us show you how Event Software can transform your events

AI-powered event management platform that helps you create stunning events .